Friday, August 31, 2012

Paul Beckwith on ice speed and drift - update 1


Above image shows Arctic sea ice extent (total area of at least 15% ice concentration) for the last 7 years, compared to the average 1972-2011, as calculated by the Polar View team at the University of Bremen, Germany.

View Paul Beckwith's August 30 presentation on sea ice speed and drift by clicking on the following link:
https://docs.google.com/file/d/0ByLujhsHsxP7VTlsczIyalpjNDQ/edit


Or, view the presentation in the window below (it may take some time for the file to fully load).


Two earthquakes off the coast of Jan Mayen Island

Two earthquakes struck the waters off the coast of Jan Mayen Island on August 30, 2012. One had  a magnitude of 6.8 on the Richter Scale and occurred at 13:43 pm (UTC), and was followed eight minutes later by a second one with a magnitude of 5.2 on the Richter Scale that took place on 13:51 pm (UTC).

The location of the earthquakes is indicated by the blue square on the top left of the USGS map below.


The Google map below shows that the location is on fault line extending north into the Arctic Ocean.


The map below shows the two earthquakes at the top in orange. The map shows all earthquakes with a magnitude 5.0 or higher that happened worldwide from August 1 to 30, 2012.


The largest earthquake in August 2012 was a magnitude 7.7 quake on August 14 in the Sea of Okhotsk, close to Sakhalin, Russia's largest island.  With a depth of 626 km (389 miles), it was a "deep-focus" earthquake. Such quakes can be felt at great distance from their epicenters.

As the above map shows, this 7.7 M earthquake and the two recent ones off the coast of Jan Mayen Island occurred on the same fault line that goes over the Arctic. The danger is that further earthquakes on this fault line could destabilize methane hydrates in the Arctic, triggering release of huge amounts of methane.

The map below, from this page, shows fault lines and elevation in meters.


In 2011, a number of posts were added on this topic at knol, which has meanwhile discontinued. These posts have been preserved at the following pages:
Methane linked to Seismic Activity in the Arctic
Runaway warming
Thermal expansion of the Earth's crust necessitates geoengineering


Pine Bush Tri

Location: Albany, NY
Distance: Sprint (325yd s, 11.5mi b, 3.25mi r)
Participants: 311

When I found out I was heading home for not one, but two family reunions this summer, on back-to-back weekends, I thought it would be fun if I could add in a race to the trip.  And so I signed up.  This race report is almost two months late at this point, funny how time slips by...

One of the big reasons I signed up for this race was so that some out of town family members would get to see me race.  That being said, I didn't quite realize that the swim start, T1 and T2 were all in different locations- not the most spectator-friendly race ever.  Choosing to situate themselves in T2, my parents and aunts were able to see me twice, going in/out of T2 and then coming back in for the finish.  There's something special about racing when you know you'll have some friendly faces in the crowd, and I was glad to have them there :)

Swim
The swim is in a small lake so it was short.  Crazy short.  I'm sure all of the first-timers appreciated it, but it seemed like they could've tried to cover a little more ground pond.  I was in the 10th wave and they ended up starting 15min late, so I had some time to stand around and...  wait.  The water temperature was perfectly comfortable sans wetsuit and while it wasn't clear, there wasn't much of any muck to contend with (I heard some chatter about it beforehand, so I was a little worried).  In my wave were both men and women in my age group, so I was a little unsure of where to start.  Turns out I overestimated others' ability and wasn't able to swim my own pace.  Before you knew it, though, we were already at the shore.

And is a really big beef from this race:  timing.  Since when do we not separate out transition times from the other disciplines???  I didn't pay too much attention to the placement of the timing mats during the race so I have no idea where the breakdowns were; all that is listed in the results is swim, bike, run and overall times.  #wtf


Bike
The bike course is a mix of pine bush preserves and sectioned off major roads, with some gentle rollers along the way.  I did what I could to push here, but 60miles in the Adirondacks & central NY in the week leading up to the race left me with legs that only had so much to give :-P  What can I say, I couldn't help but take advantage of my surroundings!


Run
The run is an out and back, with a little lollipop in the middle.  There's a sizable hill at the beginning/end of the course so you know what to expect when you head down it out of T2.  While I didn't have that much left on the bike, I was feeling good on the run and kept passing people (none of whom were in my age group), so I couldn't help but wonder if I had a chance to place.   I was able to power up the hill and finish strong in 1:13:10.  Or so they say.  Based on what I saw on the clock and my wave, I thought it should've been 1:10??

top of the hill, in the home stretch

While I like racing by perceived effort and not having to worry about hitting the start/lap/stop button, this experience has made me realize that I still want those numbers!!!  I can't help but want to compare past performances and want to improve.

I did have a good race though, and my parents and aunts cheered me on to a 4th place AG finish  (79th overall).  Which I was unhappy about until I was on my way back to Boston and realized that I left the blueberries I picked for jam-making in my parents fridge.  That quickly became the tragedy, and I realized that no matter what place I finished, I was satisfied with my performance ;)

Wednesday, August 29, 2012

Strawberry Basil Scones

It's tea time for this month's 5 Star Foodie Makeover!


When I heard plans for our virtual British afternoon tea, I immediately thought of strawberries and cream.  I know, I know, more Wimbledon than tea party, but I couldn't shake the idea and decided to morph it into something you would normally see at a tea party...  scones!


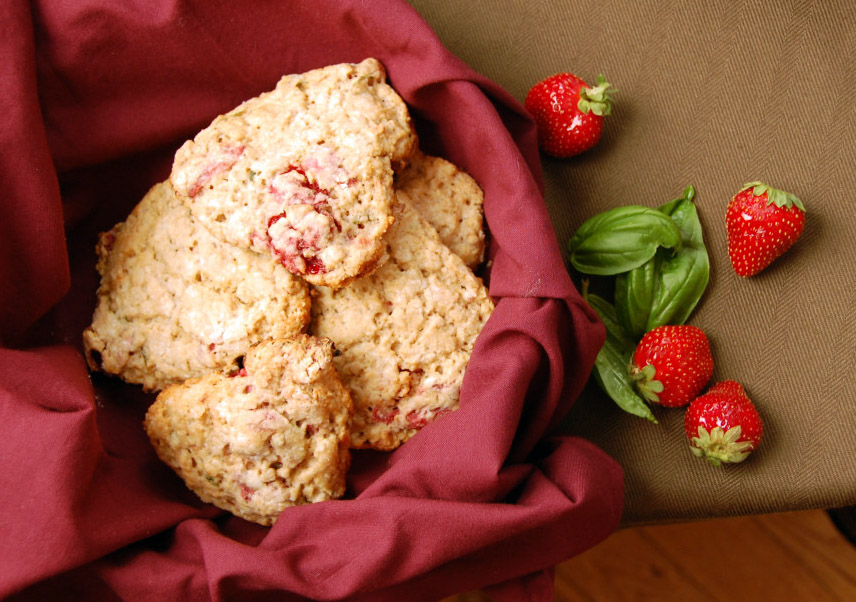
My incarnation of strawberries and cream turned into a strawberry basil scone served with coconut cream.  Dehydrating the berries a bit helped prevent adding alot of extra moisture to the scones.  They were quite delicious, especially served alongside some tea, however I realized that I don't have any "proper" tea cups!  Please excuse the oversize mugs that I'm partial to :)


Strawberry Basil Scones w/Coconut Cream
scones adapted from A Cozy Kitchen, coconut cream from Cook's Illustrated (found here)
yield:  6 scones

If you have a chance, put your coconut milk in the fridge the day or two before you're planning on making the scones, it will help solidify the cream of coconut!

For the scones:
8 medium strawberries, quartered
1c flour (I used a mix of white whole wheat, oat and cake flour*)
1 1/2t baking powder
1 1/2T evaporated cane juice (or granulated sugar)
1/4t fine sea salt
2 1/2T unsalted butter, cold  (could use Earth Balance to make these completely dairy-free)
6 medium basil leaves
1/2c coconut milk (full fat, or heavy cream), plus a little extra

For the coconut cream:
1 can full fat coconut milk
1 1/2t evaporated cane juice (or granulated sugar)
1/2t vanilla extract
pinch salt

Preheat the oven to 200deg.

Place strawberries on a parchment paper-lined baking sheet.  Bake the strawberries for 45min-1hr, until they are slightly dehydrated.  Set aside to cool.

Turn the oven to 425deg.  Place a mixing bowl and beaters into the freezer.

In a medium bowl, add flour, baking powder, sugar and salt.  Whisk together.  Grate in butter and using your hands, quickly work the butter into the flour until it resembles a coarse meal.  Chiffonade basil leaves (roll into a cigar and slice, creating ribbons) and add them to the flour/butter mixture along with the strawberries.  Gently combine and then pour in coconut milk and mix until the dough begins to form, ~30sec.

Transfer dough to a lightly floured surface and knead by hand just until it comes together into a rough, slightly sticky ball, 5-10sec.  Pat dough into a 1" thick circle and cut into 6 wedges  (or 4 or 8, if you prefer).  Put scones on a baking sheet lined with parchment paper.  Brush with coconut milk and then bake 12-15min, until scones are light brown.

While the scones are baking, remove the can of coconut milk from the fridge and the bowl/beaters from the freezer.  Using a spoon, take off the top layer of cream that should have formed (reminded me of shortening) and add it to the bowl.  Add in the sugar, vanilla and pinch of salt.  Beat on low speed until small bubbles form, ~30sec.  Increase the speed to high and beat until the cream thickens and light peaks form, ~2min. Refrigerate until your scones are done cooling.

Once the scones are done, transfer them to a wire rack for at least 10min to cool before serving with coconut cream.


*Yes, I need to go to the store!


Have you ever been to an afternoon tea?  What's your favorite treat?

Arctic sea ice area already shrank by over 81 percent this year


Arctic sea ice area already shrank by over 81% this year.

Arctic sea ice area was 13.70851 million square km on the 88th day of 2012, as illustrated on the image below by The Cryosphere Today.  The image further below shows that only 2.59449 million square km was left of Arctic sea ice area on the 238th day of 2012. In other words, less than 19% is left of the sea ice area there was earlier this year.

And there's still quite a few days to go in the melting season.


Tuesday, August 28, 2012

Arctic Sea Ice Collapse Food Emergency

Arctic Sea Ice Collapse Food Emergency
a video by Peter Carter of
ArcticClimateEmergency.com


Diagram of Doom


Above diagram was part of a poster displayed at the 2011 AGU meeting in San Francisco by the Arctic Methane Emergency Group (AMEG). It was accompanied by the following text: In the Arctic, three problems are compounding one another: emissions causing global warming, sea ice loss causing accelerated warming, and methane releases further accelerating Arctic warming, with the danger of triggering runaway global warming.

The diagram pictures three kinds of warming and their main causes:
  1. Emissions by people causing global warming, with temperatures rising around the globe, including the Arctic.
  2. Soot, dust and volatile organic compounds settling down on snow and ice, causing albedo change. More heat is absorbed, rather than reflected as was previously the case. This causes accelerated warming in the Arctic.
  3. Accelerated warming in the Arctic threatening to weaken methane stores in the Arctic with the danger that methane releases will trigger runaway global warming.

The diagram also pictures two feedback effects that make things even worse:
  • Albedo feedback: Accelerated warming in the Arctic speeds up sea ice loss, further accelerating albedo change.
  • Methane feedback: Methane releases in the Arctic further add to the acceleration of warming in the Arctic, further contributing to weaken Arctic methane stores and increasing the danger that methane releases will trigger runaway global warming.

Albedo change in the Arctic comprises a number of elements, as depicted in the image below, from the 2004 report Impacts of a Warming Arctic - Arctic Climate Impact Assessmentby the International Arctic Science Committee.  


As described in various posts at this blog over time, there are further points that should be taken into account. Regarding sea ice loss, it's clear that where sea ice retreats, more open water appears, with the result that less sunlight is reflected back into space. Accelerated warming will also affect the integrity of the remaining sea ice, as well as of the snow and ice cover on land, including glaciers. This further adds to the albedo effect, causing less sunlight to be reflected back into space. Similarly, further feedbacks could be added or described in more detail.

Accordingly, ten feedbacks can be identified, and described as follows:
  1. Albedo feedback: Accelerated warming in the Arctic speeds up the decline of ice and snow cover, further accelerating albedo change. 
  2. Methane feedback: Methane releases in the Arctic further add to the acceleration of warming in the Arctic, further contributing to weaken Arctic methane stores and increasing the danger that methane releases will trigger runaway global warming. 
  3. Currents feedback: Sea ice loss can cause vertical sea currents to weaken, reducing the cooling effect they had on the seabed. This can thus further cause sediments to warm up that can contain huge amounts of methane in the form of free gas and hydrates. 
  4. Storms feedback: Increased frequency and intensity of storms can cause substantially more vertical mixing of the sea water column, causing more warming of the seabed, thus further contributing to the warming of sediments, as above. 
  5. Storms feedback: Accelerated warming in the Arctic can result in more storms, causing mixing of cold Arctic air with warmer air from outside the Arctic. The net result is a warmer Arctic. 
  6. Storms feedback: More open waters can result in more storms that can push the ice across the Arctic Ocean, and possibly all the way out of the Arctic Ocean. 
  7. Storms feedback: Storms also cause more waves that break up the sea ice. Smaller pieces of ice melt quicker than large pieces. A large flat and solid layer of ice is also less susceptible to wind than many lighter and smaller pieces of ice that will stand out above the water and capture the wind like the sails of yachts. 
  8. Storms feedback: Storms cause waters to become more wavy. Calm waters can reflect much sunlight back into space, acting as a mirror, especially when the sun shines under a low angle. Wavy waters, on the other hand, absorb more sunlight. 
  9. Fires feedback: More extreme weather comes with heatwaves and storms. Thus, this is in part another storms feedback. The combination of storms and fires can be deadly. Heatwaves can spark fires that, when fueled up by storms, turn into firestorms affecting huge areas and causing huge amounts of emissions. Storms can whip up particles that when deposited on ice, snow or the bare soil, can cause more sunlight to be absorbed. 
  10. Open doors feedback: Accelerated warming in the Arctic causes the polar vortex and jet stream to weaken, causing more extreme weather and making it easier for warm air to enter the Arctic.

These ten feedback are depicted in the diagram below. 


Opening further Doorways to Doom


Until now, the Arctic has been protected from overheating in a number of ways.


Negative Arctic Oscillation conditions are associated with
higher pressure in the Arctic and a weakened polar vortex
(yellow arrows). A weakened jet stream (black arrows) is  
characterized by larger-amplitude meanders in its trajectory
and a reduction in the wave speed of those meanders.
Snow and ice that grows in winter will act as a buffer when temperatures rise in summer. A bright snow and ice cover will reflect most sunlight back into space. Furthermore, a lot of the sunlight that isn't reflected will be consumed by the process of turning snow and ice into water, which occurs while temperatures remain at the melting point of 0°C (32°F, 273.15 K).

The Arctic is further protected from overheating by the polar vortex and jet stream, which act to keep cold air in the Arctic and keep warm air out. However, accelerated warming in the Arctic is now causing the polar vortex and jet stream to weaken. 


Accelerated warming in the Arctic alters the polar jet stream by slowing its speed and by increasing its waviness. Larger swings in the jet stream allow frigid air from the Arctic to plunge farther south, as well as warm, moist tropical air to penetrate northward, explains Jennifer Francis, research
professor at the Institute of Marine and Coastal
Sciences at Rutgers University.

The polar jet stream can travel at speeds greater than 100 mph. Here, the fastest winds are colored red; 
slower winds are blue. View animated version here. Credit: NASA/Goddard Space Flight Center

What is described above can be regarded as an "open doors feedback". It's like leaving the doors open when it's cold inside and hot outside.

Accelerated warming in the Arctic comes with many such feedbacks, e.g. higher temperatures and more open water in the Arctic can also be expected to increase the danger that storms will batter the sea ice with greater ferocity. This is depicted in the image below.


In many ways, this is opening the doorways to doom. The biggest danger is that temperature rises will cause Arctic methane stores to weaken, resulting in huge amounts of methane to be released, triggering warming that could escalate into runaway global warming.  

The image below shows the sea surface temperature anomaly for August 27, 2012, by the National Oceanic and Atmospheric Administration (NOAA).


Rising temperatures in the Arctic threaten to trigger methane releases, as shown on the poster below.


The poster is also part of the presentation below:


Monday, August 27, 2012

Paul Beckwith on ice speed and drift


Above image shows Arctic sea ice extent (total area of at least 15% ice concentration) for the last 7 years, compared to the average 1972-2011, as calculated by the Polar View team at the University of Bremen, Germany.

View Paul Beckwith's August 27 presentation on sea ice speed and drift by clicking on the following link:
https://docs.google.com/file/d/0ByLujhsHsxP7OXliVnN4T3lnekE/edit


Or, view the presentation in the window below (it may take some time for the file to fully load).


NSIDC: Arctic sea ice breaks lowest extent on record

The National Snow and Ice Data Center (NSIDC) reports that Arctic sea ice has broken the previously lowest extent on record, which was in 2007.

Arctic sea ice extent fell to 4.10 million square kilometers (1.58 million square miles) on August 26, 2012. This was 70,000 square kilometers (27,000 square miles) below the September 18, 2007 daily extent of 4.17 million square kilometers (1.61 million square miles).

NSIDC scientist Walt Meier said, "By itself it's just a number, and occasionally records are going to get set. But in the context of what's happened in the last several years and throughout the satellite record, it's an indication that the Arctic sea ice cover is fundamentally changing."

According to NSIDC Director Mark Serreze, "The previous record, set in 2007, occurred because of near perfect summer weather for melting ice. Apart from one big storm in early August, weather patterns this year were unremarkable. The ice is so thin and weak now, it doesn't matter how the winds blow."

"The Arctic used to be dominated by multiyear ice, or ice that stayed around for several years," Meier said. "Now it's becoming more of a seasonal ice cover and large areas are now prone to melting out in summer."

With two to three weeks left in the melt season, NSIDC scientists anticipate that the minimum ice extent could fall even lower.

References
NSIDC: Arctic sea ice breaks lowest extent
NSIDC Media Advisory: Arctic sea ice breaks lowest extent on record
NSIDC: Arctic Sea Ice News and Analysis


Saturday, August 25, 2012

Future of Arctic Ice: The Three Perspectives

By Veli Albert Kallio
Veli Albert Kallio in front of Peter Wadhams and John Nissen at
APPCCG event, March 13, 2012, House of Commons, London


I use three type sources to assess climate:
  1. the peer-reviewed literature and news reports; 
  2. the whistle-blower organisations (Wikileaks, Cialeaks that release data files from the US Army, Navy, Air Force, CIA, the US State Department, or intercepted corporate telephone or Internet communications; and 
  3. indigenous people’s organisations and their ethnoclimatology people.

June 26, 2012: the Cialeaks released data files from the US stating that the North Pole will be ice free in 2013. These appear to be submarine upward sonar readings of ice from the US Navy. These contrast strongly what NSIDC is saying about the sea ice surviving much longer. I do not know the reason why US Navy and NSIDC advice differently on this point (an exponential trend projection based on PIOMAS data gives zero-ice 2015).

As per the question, where all heat goes after the sea ice has melted, I stick to the advice given in the United Nations General Assembly motion 101292: the Polar Ice responds extremely fast: first the sea ice melts and disintegrates, then followed by intense methane surges and equally rapid losses of the Arctic terrestrial ice cover in Greenland which never melts, but collapses instead.

After the sea ice loss, the permafrost and Greenland Ice Sheet take up a large portion of that energy that was previously used to melt the sea ice during the short summers. As a result, the ocean warms up and rains much more water than now with the flash-floods becoming very frequent in Greenland. As a result many times more water appears on top of Greenland’s Ice Sheet.

Greenland Ice Sheet rapidly metamorphoses from a (cold, dry, stable) moraine-forming ice sheet into a (warm, wet, dynamic) aggregate-forming ice sheet as the water amount within ice sheet and at its base increase. The bottom part of the ice sheet turns increasingly into water-logged, “mushy” ice that loses its internal strength, while pot holes on bedrocks become filled by water.

By 2020's 1/3 of Greenland Ice Sheet's base (between ice and bedrock) is dotted with water ponds at which point the rapid erosion processes (cavitation, plucking and kolking) pulverise the ice so aggressively that an "ice sheet thrust" develops against coastal perimeter at Melville Bay area. Even the dry parts of ice sheet then no longer can hold the ice dome in place and Heindrich Ice Berg Calving Event (H-1) occurs.

After the Heindrich Minus One (H-1) event the North Atlantic Ocean between America and Europe fills by broken ice that triggers a near-instantaneous severe climate cooling: the Last Dryas. Europe will see many years lasting freeze with Dryas Octopetala rapidly taking hold across continent's then barren soils. The ice volume is 10 times less in Greenland than in a similar event when the Hudson Bay Ice Dome reminders collapsed.

This ice evolution history of the First Nations of Americas as expressed on the UN General Assembly motion 101292 and the Plantagon Declarations, were used on the global-warming themed film “A Day After Tomorrow” and also “2012” by director Roland Emmerlich. Unfortunately, the films assigned incorrect physics and caused great annoyance among the Native American Indian communities due to many other inaccuracies in details therein:

“2012” films ‘mystery radiation of sun’ was never caused by neutrinos, but methane: the Bøllinger Years. The ‘core melting’ was due to the displacement of asthenosphere’s fluids as the heavy Foxe-Laurentide Ice Dome destabilised forcing the liquid minerals in asthenosphere to move out of way, the pressures causing huge eruptions and lava floods (asthenosphere is like a “wet sponge”, a composite of solid and liquid minerals).

“A Day After Tomorrow’s freeze failed the Boyle’s Law: ultra-cold stratosphere cannot fall, and cause instantaneous sea level jump that was followed by the Younger Dryas freeze-up, but ice can.

The First Nations of Americas have raised the alarm very clearly continuously for the last 20 years since the first Rio de Janeiro summit in 1992 that the West is living in delusions (including its scientists). Just like the perimeter between the south tip of the Baffin Island and the north tip of Newfoundland once failed, ending the Ice Ages, the rapid melt water accumulation same way destroys now Greenland’s perimeter barrier at Melville Bay. Wet solidus damage causing lava floods and inlet fjord leaks can suddenly speed it up even more unpredictably.

Here is Professor Oren Lyon Jr.’s (Native American Tradition-Keeper and Historian of the Six Nations who worked at the University of Buffalo), the Internet summary of the Plantagon Declarations: http://www.youtube.com/watch?v=4OjjPETcz6A

There is no point just to observe and repeat only points that appear in the professional literature. I want other communities’ perspectives and wisdom to be also realised and acknowledged:

+ either: the ancient experiences of the ancient people,

+ or: for the huge risks that people take to uncover often illegal practises by the corporations who are often acting in tacit co-operation with government officials, scientists or industrialists who are hostile to admit publically the role of greenhouse gases that violate their pet paradigm that the economic growth can be based on infinite growth from fossil-fuelled supply of goods and services.

Veli Albert Kallio, FRGS
International Guru Nanak Peace Prize Nominee for 2008;
sea level rise risk for global security & economic stability.

How much sea ice is lost daily?

How much sea ice is lost in the Arctic daily? What are your estimates (in square km and cubic km)? 


Paul Beckwith
Paul Beckwith, B.Eng, M.Sc. (Physics),
Ph. D. student (Climatology) and
Part-time Professor, University of Ottawa

Losses of 100,000 square kilometer per day loss of sea ice area are being reported by various sources. Images of ice speed and drift, in conjunction with ice thickness, would support this.

This rate of loss is as large as that lost during the August 3rd to 10th cyclone (700,000 to 800,000 square kilometers lost for the duration of the cyclone).

My prediction that we'll lose virtually all sea ice by September 30th, 2012, still seems very reasonable.


Sam Carana

I too estimate there have been losses of 100,000 square kilometer per day for over two months now.

The top image at my recent post on ice extent shows that extent has roughly halved in two months time, from over 12 million square km at the start of June to roughly 6 million square km at the start of August. That's a loss of about 6 million square km in two months time, or about 100,000 square km per day.

To date, this loss rate appears to have continued in August and shows no signs of decreasing yet.

Cyclone Warning

By Harold Hensel, edited by Sam Carana

The Google Earth view below shows an Arctic Cyclone going over Alaska and entering the Arctic Ocean.

Arctic - Google Earth view
The warm rain and wind will further deteriorate the North Pole Ice Cap.

In case you're looking for news in Tropical Storm ISAAC, see the images below.

Tropical Storm ISAAC - Google Earth view
Tropical Storm ISAAC - NOAA image
Above image and the image below are from the NOAA National Hurricane Center. For updates on ISAAC, check that site!
Tropical Storm ISAAC - NOAA image


Friday, August 24, 2012

Arctic sea ice extent update

The image below shows sea ice extent as calculated by the Polar View team at the University of Bremen, Germany, updated August 25, 2012.


The image below, edited from the National Snow & Ice Data Center (NSIDC), shows the situation according to the NSIDC updated at August 23, 2012. It's clear that Arctic sea ice extent looks set to reach the 2007 record low within days, if it hasn't been reached already now.


For updates, see the daily images produced by the NSIDC. Note that, to calculate extent, both the NSIDC and the Univeristy of Bremen include areas that show at least 15% sea ice. In the image below, from the Danish Meteorological Institute (DMI), areas with ice concentration higher than 30% are included to calculate ice extent.


Monday, August 20, 2012

Record low sea ice area


Arctic sea ice area reached a record low of 2.87746 million square km on the 230th day of 2012, as illustrated on the image below by The Cryosphere Today.


Below the sea surface temperature anomaly for August 20, 2012, by the National Oceanic and Atmospheric Administration (NOAA).


Rising temperatures in the Arctic threaten to trigger methane releases, as shown on the poster below.


The poster forms part of the updated presentation Why act now, and how?

Peach Vanilla Jam

Every time I think about peaches a certain song immediately pops into my head and usually stays for too long.  Who can complain when you're biting into a ripe, juicy peach though ;)

I'm going to can some peach jam this year, but this was actually made last year at the very end of peach season so you get this one first!  The skins were left on to add some fiber and texture, but feel free to peel your peaches (after a quick dip in boiling water) if you so desire.


Peach Vanilla Freezer Jam
adapted from Confessions of a Tart
yield:  3 jars

This jam is perfect on a biscuit, cheese platter, almond butter & jelly sandwich, stirred into yogurt...  you get the idea!

5 1/2c thinly sliced peaches  (peeled if you prefer)
1/2-3/4c packed brown sugara
juice of 1 lemon
1/2t vanilla extract
1/4t almond extract
seeds scraped from 3 vanilla beans

Add all ingredients to a medium bowl and stir until the sugar dissolves.  Refrigerate for 1-2 hours (or overnight).

Transfer fruit to a heavy-bottomed sauce pan and heat to medium high.  Bring to a boil, then reduce to low and gently simmer for 15-20min or more until jam has thickened.  Try the nudge test with a chilled plate to test if it's done.

If you want a chunky jam, you're done!  If you'd like a smoother jam, transfer (all or a portion) into a blender and process until it has reached your desired consistency.  Spoon into jar and freeze (for quite a few months) or refrigerate (for a few weeks).


Now, who's got a killer recipe for peach pie??

Sunday, August 19, 2012

Tipping Points

The increasing melt may be a harbinger of greater changes such as the release of methane compounds from frozen soils that could exacerbate warming, and a thaw of the Greenland ice sheet, which would contribute to rising sea levels, NASA’s top climate scientist, James Hansen, said in an e-mail interview, reports Bloomberg.

“Our greatest concern is that loss of Arctic sea ice creates a grave threat of passing two other tipping points -- the potential instability of the Greenland ice sheet and methane hydrates,” Hansen said. “These latter two tipping points would have consequences that are practically irreversible on time scales of relevance to humanity.”


Above image shows methane levels over a period of four years, from August 1, 2008, to August 1, 2012.


Above image shows methane levels over one years, from August 1, 2011, to August 1, 2012. This shows a marked increase in methane levels on the last of the four years further above.


Above image shows methane levels from August 1, 2012, to August 15, 2012. The image shows high levels of methane across the northern hemisphere. Note the high levels above Greenland.

Friday, August 17, 2012

Arctic sea ice updates


Above diagram shows sea ice extent as calculated by the Polar View team at the University of Bremen, Germany.

Paul Beckwith warns that a second cyclone is threatening to batter the remaining sea ice soon.

View Paul's presentation by clicking on the link below.
https://docs.google.com/file/d/0ByLujhsHsxP7cnB0bXhNNFFSQjQ/edit


Or, view the presentation in the window below (it may take some time for the file to fully load).


and below, Paul's August 17 update:

Opening the Doorways to Doom

Snow and ice protect the Arctic from overheating in summer. Firstly the brightness of the snow and ice cover ensures that most sunlight gets reflected back into space. Secondly, a lot of the sunlight that isn't reflected will be consumed by the process of turning snow and ice into water, which occurs while temperatures remain at the melting point of 0°C (32°F, 273.15 K). 

The Arctic is further protected from overheating by the polar jet stream, which keeps cold air in the Arctic and keeps warm air out. 
The polar jet stream can travel at speeds greater than 100 mph. Here, the fastest winds are colored red; slower winds are blue. View animated version here. Credit: NASA/Goddard Space Flight Center

Accelerated warming in the Arctic can alter the polar jet stream in a number of ways, firstly by slowing its speed and secondly by increasing its waviness. Larger swings in the jet stream allow frigid air from the Arctic to plunge farther south, as well as warm, moist tropical air to penetrate northward, explains Jennifer Francis, research professor at the Institute of Marine and Coastal Sciences at Rutgers University. 

Accelerated warming in the Arctic comes with many feedbacks, and this "open doors feedback" is only one of them. Higher temperatures and more open water in the Arctic can also be expected to increase the danger that storms will batter the sea ice with greater ferocity. 


In many ways, it's opening the doorways to doom. The biggest danger is that Arctic methane stores will weaken, causing huge amounts of methane to be released, triggering warming that could escalate into runaway global warming.  

Thursday, August 16, 2012

Damned Torpedos, Huauzontle Ahead


Li-hing-rubbed torpedo with weird huauzontle and 
diced peppers

Torpedo with poached peaches on bulgur farrotto 
flavored with saffron and sage

Herb crusted torpedo with caramelized 
onion and fennel, on apple-onion risotto

One of my favorite ways to prepare sweet Italian sausage is as an oblong patty, locally known as a torpedo. Paulina Market sells beautiful torpedoes, so I usually get one one or two on every marketing trip. These trips usually include a swing by Andy's for vegetables, and it's there I discovered huauzontle*, branches of green buds that looked like a cross between broccoli and sticky nugs of boutique weed. One of the weirdest foods I've ever looked at, much less cooked.

Huauzontle

There was only one bunch of huauzontle at Andy's, and the guy in the apron had no idea how to prepare it or eat it. Or in fact what it was called. All he knew was that it was "Mexican.**" Naturally I bought them (it?) and when I got home I Googled "weird looking Mexican vegetable like broccoli or marijuana buds" and got nowhere. Clicking the "images" link got me to epazote***, another plant eaten by Mexicans, then some sidebars got me to huauzontle****. I now knew what it was, but instructions on cooking it were limited to "use like spinach" and a few references to fried fritters made with the buds.

Since the torpedo of sausage can be imposing if it's presented as a briquet, I usually serve it in slices over something like rice, bulgur or greens, and if I could figure out how to cook them like spinach, as intimated on the internets, the bulbous green tufts of huauzontle seemed like they'd be a fine match. Or maybe poison, who knows.

I tried a nibble of a huauzontle***** raw and it was pretty dull. Like a chlorophyllic version of the little nub on the end of a shoelace. I decided to try cooking the florets on the stove with some liquid in a covered pan, just close my eyes and pretend it was spinach or kale and hope for the best.

I sliced some garlic and onions and wilted them in a saucepan with some olive oil and diced bacon, then added the huauzontle buds after stripping them from the stalks. The stalks seemed impossibly tough and woody so there seemed no point in trying to eat them. Perhaps if they're straight from the huauzontle patch (tree?) and haven't sat around a produce section for a while even the stalks would be edible, I don't know. In their present state they were kindling, not food. The buds didn't seem to be rendering any liquid, so I added a generous glug of white wine, and once the alcohol had boiled off I seasoned the pan with some salt and crushed dry birdseye chile, covered it and turned it down to a simmer.

The torpedo was pretty straightforward. I made a wet rub of li-hing powder, salt, black pepper, olive oil and mashed garlic, coated the torpedo with it and browned it in a hot skillet. When both sides had a healthy crust on them, I added a couple glugs of white wine and covered the skillet to braise the sausage. If cooked entirely by searing, the fat and juice tend to drain out of the torpedo******, leaving a more-or-less conventional sausage patty, curled into the unappealing shape of the cup of an athletic supporter. Braised in liquid, the torpedo stays juicy and swells itself into a plump little lozenge shape that is much easier to slice and has no unfortunate associations.

When plump and ready, I removed the torpedo to a plate to rest, and added the huauzontle to the skillet along with its pan juices. Since the huauzontle didn't generate any pot liquor of its own, the extra moisture of the braising liquid would be useful, and if the vegetable was as flavorless cooked as it was raw, the added flavor could save the dish. I left the pan on a high fire to reduce the liquid, and when most of it was absorbed into the greens I added some chopped scallions and mint, tossed everything together and put portions onto plates.

I sliced the torpedo slightly diagonally to make nice presentation slices and arranged them on the huauzontle, drizzling the collected juices over everything. The plate looked a little drab so I grated some home-made cheese over everything and diced a small red pepper from the alley as a garnish.

The torpedo came out well, the seared exterior had a sharp bite to it and the li-hing had penetrated to add both a nice pink color and a whiff of licorice that complimented the fennel in the sausage itself.

The huauazontle was fine if not remarkable. The flavor was mild and slightly musky, and the greens absorbed considerable flavor from the wine, garlic and braising liquid. The li-hing in particular added a welcome anise undertone that complimented the lean nature of the greens as well as it did the succulence of the sausage. After a total of about 20 minutes cooking, the buds weren't tough, though the stemmy bits were stick-like and stiff as matchsticks. Further cooking would probably be pointless, so I think the solution would be to be careful in stripping the buds off the stems.

On the whole, huauazontle is unremarkable to eat. Weird to look at and weird that anybody ever thought to eat a bunch of twigs with some buds on the end, but otherwise not special. Didn't smoke any.


*Pronounced "Wha-Wha-Zoontee-Lah" according to me, because of how I decided to say it.
**He was not Mexican. I know because I asked him. So I guess that was racist. Him saying huauzontle was Mexican is racist, not me asking him I mean. Was it rude to ask if he was Mexican? I mean how did he know?
***Pronounced "EP with non-LP B-side," 
****Google search also inexplicably got me to these:
*****Really, huauzontle? Is that the name? It sounds like a Jon Wurster character.
******TWSS

CryoSat


The image below shows how much the older, thicker sea ice has declined over the years. This decline doesn't become apparent when focusing on sea ice extent; volume measurements are needed to reveal this decline.

Old versus new ice in Arctic: The maps show the median age of sea ice in March 1985 (left) and March 2011 (right).
Overall, the proportion of old ice has decreased. By March 2011, ice over 4 years old accounts for less than
10% of the Arctic ice cover. Credit: National Snow and Ice Data Center, University of Colorado, Boulder.
The screenshot below shows GHRSST volume measurements from National Centre for Ocean Forecasting website.


The European Space Agency's CryoSat promises to deliver an even clearer picture. One of the scientists analyzing the CryoSat data, Dr Seymour Laxon, said in April 2012 that CryoSat's volume estimate is very similar to that of PIOMAS, the model developed at the Polar Science Center at the University of Washington.

In a recent interview, Dr Laxon said that if the current trend continues, the Arctic could be ice-free at the height of summer by the end of the decade.

John Nissen, Chair of the Arctic Methane Emergency Group (AMEG), comments: "Dr Laxon failed to mention the data on sea ice thickness that has been collected over many years by sea ice expert Professor Peter Wadhams of the University of Cambridge, who now considers that the Arctic Ocean will be seasonally free of sea ice most probably by September 2016. PIOMAS sea ice volume data suggest that a collapse in sea ice area could occur even sooner, as discussed on the AMEG blog posting."