Comprehensive climate action will do more than just cutting emissions, it will also take further action, as pictured in the image below.
Comprehensive and effective action is discussed at the Climate Plan blog
Taking a broad perspective makes it easier for proposed projects to be assessed on their benefits in a multitude of areas.
Ocean tunnels can capture vast amounts of energy from ocean currents, such as the Gulf Stream and the Kuroshio Current. These locations are close to areas with high energy demand, such as the North American East Coast and the coast of East Asia, which can reduce the need for long distance transmission lines.
Ocean tunnels provide clean energy continuously, i.e. 24 hours a day, all year long. This makes that they can satisfy demand for electricity both at peak and off-peak usage times.
Their ability to supply large amounts of electricity at times of peak demand will benefit the necessary transition from polluting to clean ways of generating electricity.
Their ability to also supply large amounts of electricity at off-peak usage times will help to reduce the price of electricity at such times, thus opening up opportunities for a number of activities that can take place at off-peak hours and that require large amounts of energy.
Such activities include large-scale grinding of olivine rock and transport of the resulting olivine sand, and large-scale production of hydrogen through electrolysis to power transport (box right). Electrolysis can also create oxygen-enriched water that can improve the quality of waters that are oxygen-depleted.
Hydrogen to power Shipping
Ocean tunnels can make electricity cheap at off-peak times. This will reduce the cost of recharging batteries of electric vehicles at night.
It will also reduce the cost of producing hydrogen at off-peak hours. To power ships crossing the oceans, hydrogen looks more cost-effective, as such ships cannot return to base for a nighly battery recharge. Such ships have plenty of cargo space to carry hydrogen, even when the hydrogen is not highly compressed. Some of the world's largest ports are close to strong ocean currents.
Ocean tunnels can generate electricity in two ways, i.e. by capturing the kinetic energy contained in the flow of ocean currents, and by means of Ocean Thermal Energy Conversion (OTEC) using temperature differences between cooler deeper parts of the ocean and warmer surface waters to run a heat engine to produce energy.
Besides generating energy, ocean tunnels can assist with further activities, which will increase the value of ocean tunnels in the fight against climate change. Such activities include the following:
By reaching deeper parts of the ocean, OTEC can pull up sunken nutrients and put them out at surface level to fertilize the waters there, while the colder water that is the output of OTEC will float down, taking along newly-grown plankton to the ocean depths before it can revert to CO2, as described in the earlier post Using the Oceans to Remove CO2 from the Atmosphere.
Ocean tunnels can be used to distribute olivine sand in the water. The force of the currents and the turbines will help the process of transforming olivine into bicarbonate. This can reduce carbon dioxide levels in the water by sequestering carbon, while also reducing ocean acidification. Olivine sand contains silicate and small amounts of iron, allowing diatoms to grow that will capture additional carbon dioxide, while also raising levels of free oxygen in the water. The latter will stimulate growth of microbes that break down methane in the water before it reaches the atmosphere. Further nutrients can be added, as also discussed in this earlier post.
Ocean tunnels can also assist with albedo changes. Ocean tunnels can act as the infrastructure to create water microbubbles along their track. Increasing water albedo in this way can reduce solar energy absorption by as much as 100 W m − 2, potentially reducing equilibrium temperatures of standing water bodies by several Kelvins, as Russel Seitz wrote back in 2010. There may also be potential for ocean tunnels to be used to spray water vapor into the air with the aim of brightening clouds over areas where it counts most.
The turbines in tunnels will also reduce the flow of ocean currents somewhat, thus reducing the flow of warm water into the Arctic. Furthermore, tunnels can be shaped in ways to guide the flow of warm water away from the Arctic Ocean down a southwards course along the Canary Current along the coast of West Africa. thus diverting warm water that would otherwise end up in the Arctic Ocean. This could also reduce the chance of hurricanes hitting the east coast of North America, as Sandy did in 2012.
The Gulf Stream, carrying warm water all the way into the Arctic Ocean
Our climate has changed, as illustrated by the image below (Forecast for Feb. 23, 2015, 1200 UTC, run on Feb. 16, 2015).
The left map shows temperatures of 40 degrees below zero moving down into North America from the Arctic, while temperatures in much of Alaska are above freezing point. The right map shows temperature anomalies over large parts of North America at both the top end (red) and the bottom end (purple) of the scale. Temperature anomaly forecasts for the week from Feb 19 to 26, 2015, feature in the video below.
Below is an update showing operational temperature anomalies recorded on February 23, 2015.
As parts of North America experienced record cold, part of Alaska was more than 20°C (36°F) warmer than it used to be (compared to 1985-1996). And despite the cold weather in parts of Canada and Greenland, the Arctic as a whole is forecast to reach, on February 26, temperature anomalies as much as 3.32°C (≈6°F) above what temperatures used to be from 1979 to 2000 (Climate Reanalyzer forecast data).
What has caused our climate to change in this way? The image below shows that the jet stream, which once used to move over North America horizontally, has become more wavy, pushing warm air north on the left, while drawing cold air from the Arctic south on the right.
Importantly, while the jet stream is becoming more wavy or elongated vertically, the speed at which it crosses the oceans can increase dramatically. This can be the case where low temperatures over land and high sea surface temperatures combine to create huge temperature differences that drive up the jet stream's speed over oceans.
This is illustrated by the image below showing the Jet Stream reaching speeds as high as 410 km/h (or 255 mph) at the green circle near Greenland on January 9, 2015 (left), and speeds as high as 403 km/h (or 250 mph) at the green circle near Greenland on February 20, 2015 (right).
The reference map on the right shows the location of the continents for the same orthgraphic coordinates as the maps above and below.
Similarly, the Polar Vortex can reach high speeds, driving cold air downward over North America and driving warm air upward over Greenland and the North Atlantic.
The image below shows the Polar Vortex reaching speeds as high as 346 km/h (or 215 mph) at the green circle near Svalbard on January 18, 2015 (left), and speeds as high as 316 km/h (or 196.4 mph) at the green circle over the Arctic Ocean on February 9, 2015 (right).
Almost one year ago, the Polar Vortex also reached speeds as high as 410 km/h (or 255 mph), as discussed in an earlier post. Changes to the polar vortex and the jet stream are caused by emissions, and the situation looks set to deteriorate even further.
Above image illustrates that, on February 16, 2015, waves higher than 10 m (32.81 ft) were recorded off the east coast of North America and south of Iceland, while waves as high as 8.15 m (26.74 ft) were recorded in between Norway and Svalbard.
As above images also illustrate, changed wind patterns are carrying warm air high up into the Arctic.
The air that is moving north is much warmer than it used to be, as sea surface temperatures off the east coast of North America are much higher than they used to be (image left and as discussed in an earlier post).
Strong winds increase the volume of warm water that the Gulf Stream carries into the Arctic Ocean. They can also cause rain storms that can devastate Arctic ice and glaciers
Arctic sea ice currently has about the lowest extent for the time of the year since satellite measurements started in 1979.
The image below shows that, on February 17, 2015, Arctic sea ice had reached an extent of merely 14.406 million square kilometers.
click on image to enlarge
The Arctic sea-ice Monitor image below shows an extent of 13,774,725 km2 for February 18, 2015, with the red line illustrating the recent fall in extent even more dramatically.
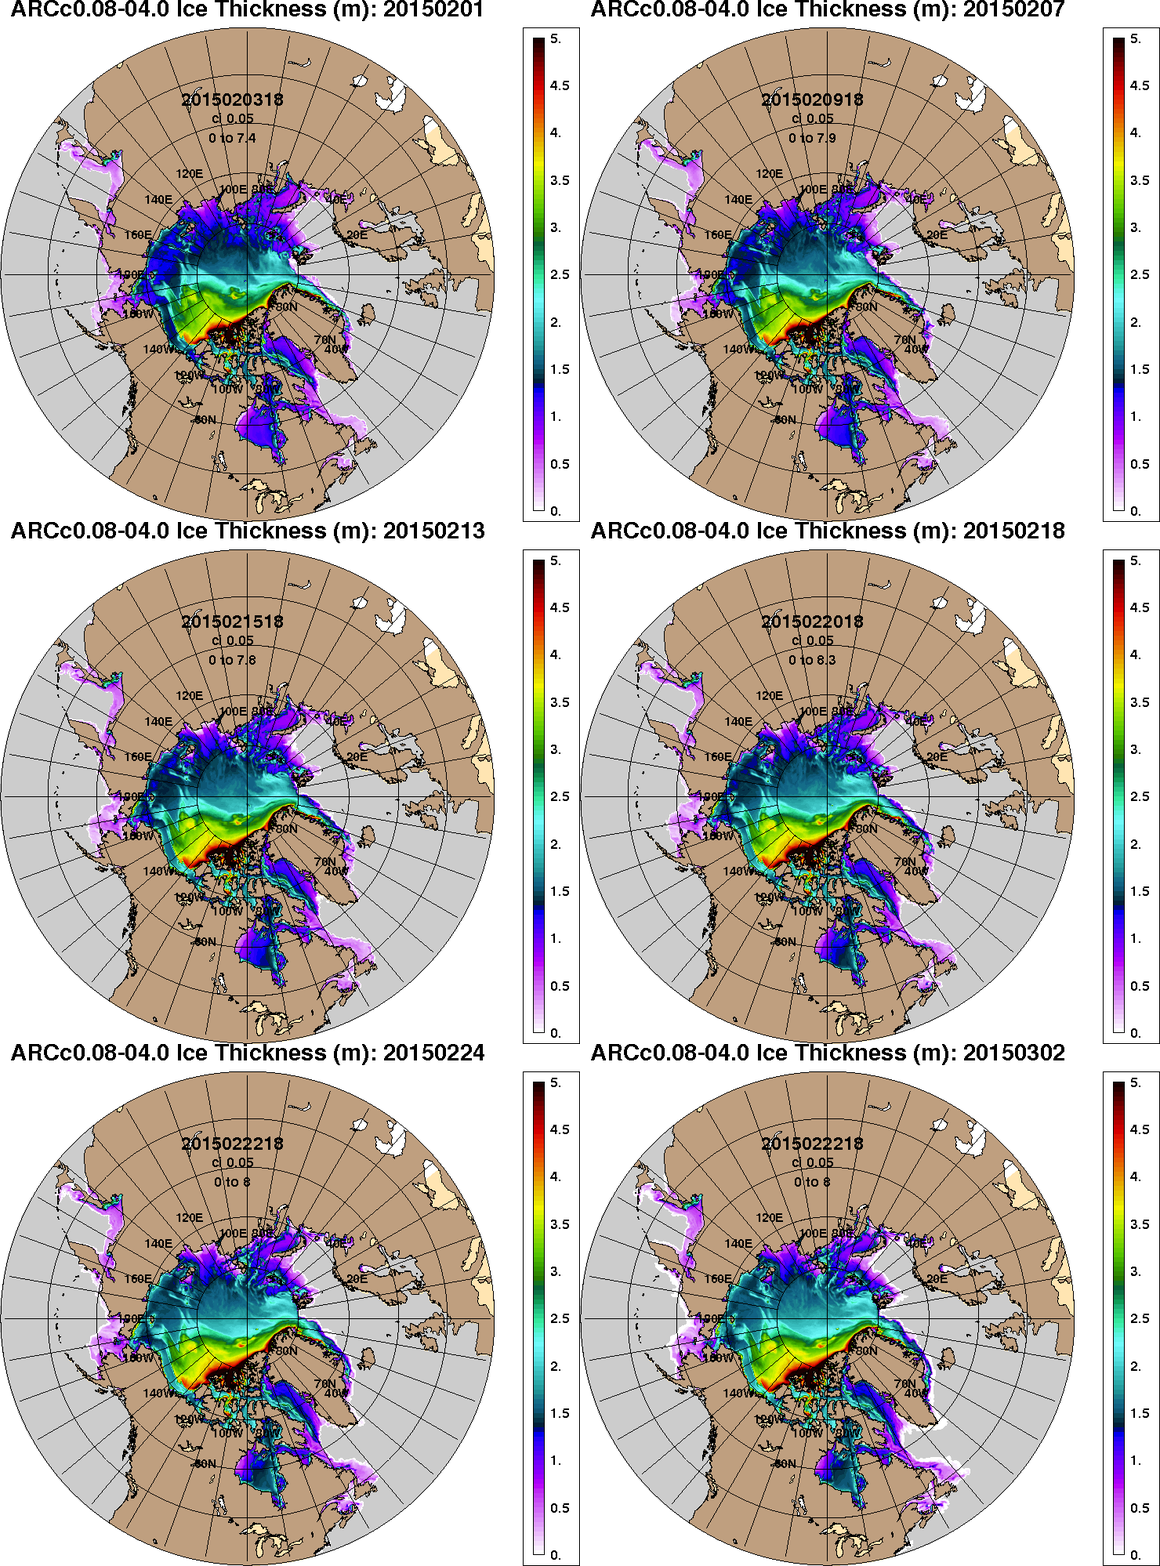
Below is a 30-day animation showing sea ice thickness (in m) up to February 22, 2015 (and forecast up to March 2), from the U.S. Naval Research Laboratory.
As the Arctic's snow and ice cover decline, more sunlight gets absorbed that previously was reflected back into space. All this adds up to a very dangerous situation, since huge amounts of methane are contained in sediments under the seafloor of the Arctic Ocean, and they can get destabilized as the water warms up.
In conclusion, feedbacks make that the Arctic is warming more rapidly than the rest of the globe and they threaten to trigger huge methane eruptions from the seafloor of the Arctic Ocean.
Methane concentrations over the Arctic Ocean are very high at the moment. The image below shows the very high peak methane levels that have recently been recorded, against a background image showing high methane levels over the East Siberian Arctic Shelf on February 20, 2015.
The situation is dire and calls for comprehensive and effective action, as discussed at the Climate Plan blog.
The presence of GHGs (greenhouse gases) in the atmosphere is vital to sustain life on our planet. These GHGs trap heat and keep the global average surface temperature of the planet at about 15°C, versus a chilly -18°C, which would be our temperature without the GHGs.
We have changed the chemistry of the atmosphere, specifically of the concentrations of the GHGs. Concentrations of carbon dioxide have increased about 40% since the start of the industrial revolution (from a tight range between 180 to 280 ppm over at least the last million years) to 400 ppm. Concentrations of methane have increased by more than 2.5x since the start of the industrial revolution (from a tight range of 350 to 700 ppb) to over 1800 ppb. The additional heat trapped has warmed our planet by over 0.8°C over the last century, with most of that rise (0.6°C) occurring in the last 3 or 4 decades.
Oceans
Over 90% of the heat trapped on the surface of the planet is increasing the temperature of the ocean water. The increased levels of carbon dioxide in the atmosphere acidify the rainfall, and have increased the acidity of the oceans by about 40% in the last 3 to 4 decades (pH of the open ocean has dropped from 8.2 down to 8.05 on the logarithmic scale). An increased drop to a pH of 7.8 will prevent calcium based shells from forming, and threaten the entire food chain of the ocean. Changes in ocean currents, and vertical temperature profiles are leading to more stratification and less overturning which is required to transport nutrients to the surface for phytoplankton to thrive.
Global sea levels are presently rising at a rate of 3.4 mm per year, compared to a rate of about 2 mm per year a few decades ago. Melt rates on Greenland have doubled in the last 4 to 5 years, and melt rates on the Antarctica Peninsula have increased even faster. Based on the last several decades, melt rates have had a doubling period of around 7 years or so. If this trend continues, we can expect a sea level rise approaching 7 meters by 2070.
Higher global average temperatures have increased the amount of water vapor in the atmosphere by about 4% over the last several decades, and around 6% since the start of the industrial revolution. Changes in heat distribution with latitude from uneven heating with latitude has slowed the jet streams and caused them to become wavier and fractured, and has changed the statistics of weather. We now have higher frequencies, intensities, and longer duration extreme weather events and also a change in location of where these events occur.
Feedback loops
The sensitivity of the climate system to increased levels of GHG appears to be much higher than previously expected due to many powerful reinforcing feedbacks.
Arctic temperature amplification from exponentially declining sea ice and spring snow cover are the strongest feedbacks in our climate system today. The average albedo (reflectivity) of the Arctic region has decreased from 52% to a present day value of 48% over 3 or 4 decades. The increased absorption of energy in the Arctic has increased the temperature at high latitudes at rates up to 6 to 8x the global average temperature change. The reduced temperature difference between the Arctic and equator has reduced the west to east speed of the jet streams causing them to slow and become wavier and more fractured, and directly causing a large change in the statistics of our global weather.
Methane gas emissions have been rapidly rising in the Arctic region from the terrestrial permafrost and the continental shelf marine sediments, most notably on the ESAS (Eastern Siberia Arctic Shelf). The extremely potent ability of methane to warm the planet (global warming potential GWP is >150, 86, and 34 times for methane relative to carbon dioxide on a few year, several decade, and century timescale, respectively) makes increased emissions an extremely dangerous risk to our well-being on the planet.
My overall assessment
Our climate system is presently undergoing preliminary stages of abrupt climate change. If allowed to continue, the planet climate system is quite capable of undergoing an average global temperature increase of 5°C to 6°C over a decade or two. Precedence for changes at such a large rate can be found at numerous times in the paleo-records. From my chair, I conclude that it is vital that we slash greenhouse gas emissions and undergo a crash program of climate engineering to cool the Arctic region and keep the methane in place in the permafrost and ocean sediments.
Paul Beckwith
Paul Beckwith is part-time professor with the laboratory for paleoclimatology and climatology, department of geography, University of Ottawa. Paul teaches climatology/meteorology and does PhD research on 'Abrupt climate change in the past and present'. Paul holds an M.Sc. in laser physics and a B.Eng. in engineering physics and reached the rank of chess master in a previous life. Click here to view Paul's earlier posts at the Arctic-news blog.
A heatwave with temperature anomalies exceeding 36°F (20°C) is expected to hit Greenland between August 16 and 22, 2014, as illustrated by the image on the left and the animation on the right.
Such heatwaves can be expected to hit the Arctic more frequently and with greater intensity, as temperatures in the Arctic are rising faster than elsewhere on Earth.
Such heatwaves can result in massive melting on Greenland, as persistent heat changes the texture of the snow and ice cover, in turn reducing its reflectivity. This makes that less sunlight is reflected back into space and is instead absorbed.
The image below illustrates what a difference the presence of sea ice can make.
As the NSIDC/NOAA graphs below shows, melting on Greenland has been relatively modest this year when compared to the situation in 2012. By July 12, 2012, 97% of the ice sheet surface had thawed, according to this NASA analysis and this NOAA Arctic Report Card.
Melting on Greenland directly affects sea level rise, and melting on Greenland is accelerating due to a number of factors.
Projections of melting on Greenland have long been based on a warming atmosphere only, ignoring the warmer waters that lubricate glaciers and that warm Greenland's bedrock canyons that sit well below sea level.
Furthermore, there are growing quantities of black carbon deposits as a result of burning of fossil fuel and biomass. High temperatures have recently caused ferocious wildfires in Canada that have in turn caused a lot of black carbon to go up high into the atmosphere.
And of course, the atmosphere over the Arctic is warming up much faster than most models had projected. This in turn causes triggers further feebacks, including more extreme weather events such as heatwaves and rain storms that can be expected to hit Greenland with ever more frequency and ferocity. Further feedbacks include methane eruptions from the heights of Greenland, as discussed at the Arctic Feedbacks Page.
When also taking into account the accelerating impact of such factors on melting in Greenland, sea levels could rise much faster than anticipated, as illustrated by the image below.
Note that sea level rise is only one of the many dangers of global warming, as discussed in the 2007 post Ten Dangers of Global Warming.
The image on the right shows a temperature forecast for August 16, 2014, with parts of Greenland changing in color from blue into green, i.e. above the melting point for snow and ice.
Such high temperatures are now hitting locations close to the North Pole ever more frequently, due to the many feedbacks that are accelerating warming in the Arctic, as discussed at this Feedbacks page.
One of the most dangerous feedbacks is a sudden eruption of huge quantities of methane from the seafloor of the Arctic Ocean, as discussed in a recent post.
The impact of such feedbacks can be accumulative and interactive, resulting in self-reinforcing feedbacks loops that can escalate into runaway warming.
Below is another forecast by ClimateReanalyzer for August 16, 2014, showing the remarkable ‘greening’ of Greenland, as well as the very high temperatures reaching the higher latitudes of North America.
Also see the very high sea surface temperatures around Greenland on the image below, created with ClimateReanalyzer.
Sea surface temperature anomalies on August 15, 2014.
In conclusion, the situation is dire and calls for comprehensive and effective action, as discussed at the Climate Plan blog.
A thick layer of smoke blankets large parts of North America, as also illustrated by the animation below based on images from July 15 to 18, 2014, from Wunderground.com.
[ note that this animation is a 2.3MB file that may take some time to fully load ]
Such wildfires can send huge amounts of carbon dioxide, methane, soot, dust and volatile organic compounds into the atmosphere. Much of this gets deposited at higher latitudes, discoloring land, snow and ice, and thus speeding up warming by absorbing more sunlight that was previously reflected back into space.
Soils at higher latitudes can contain huge amounts of carbon in the form of peat, as described in the earlier post The Threat of Wildfires in the North. There are further conditions that make the situation in the Arctic so dangerous.
Temperature anomaly March-April-May-June 2014 (JMA)
The Arctic is particularly vulnerable to warming due to geographics. Seas in the Arctic Ocean are often shallow and covered by sea ice that is disappearing rapidly. Largely surrounded by land that is also rapidly losing its snow and ice cover, the Arctic Ocean acts like a trap capturing heat carried in by the Gulf Stream, which brings in ever warmer water. Of all the heat trapped on Earth by greenhouse gases, 90% goes into oceans, while a large part of the remaining 10% goes into melting the snow and ice cover in the Arctic, as described in an earlier post. Such basic conditions make that the Arctic is prone to warming.
Then, there are huge amounts of methane held in sediments under the Arctic Ocean, in the form of hydrates and free gas. Unlike methane releases from biological sources elsewhere on Earth, methane can be released from the seafloor of the Arctic Ocean in large quantities, in sudden eruptions that are concentrated in one area.
Until now, permafrost and the sea ice have acted as a seal, preventing heat from penetrating these methane hydrates and causing further destabilization. As long as there is ice, additional energy will go into melting the ice, and temperatures will not rise. The ice also acts as a glue, keeping the soil together and preventing hydrate destabilization from pressure changes and shockwaves resulting from seismic activity. Once the ice is gone, sediments become prone to destabilization and heat can more easily move down along fractures in the sediment, reaching hydrates that had until then remained stable.
Temperature anomaly March-April-May 2014 (NASA)
When methane escapes from the seafloor of the Arctic Ocean and travels through waters that are only shallow, there is little opportunity for this methane to be broken down in the water, so a lot of it will enter the atmosphere over the Arctic Ocean. The Coriolis effect will spread the methane sideways, but latitudes over the Arctic are relatively short, making the methane return at the same spot relatively quickly, while the polar jet stream acts as a barrier keeping much of the methane within the Arctic atmosphere. In case of large methane eruptions, the atmosphere over the Arctic will quickly become supersaturated with methane that has a huge initial local warming potential.
Hydroxyl levels in the atmosphere over the Arctic are very low, extending the lifetime of methane and other precursors of stratospheric ozone and water vapor, each of which have a strong short-term local warming potential. In June/July, insolation in the Arctic is higher than anywhere else on Earth, with the potential to quickly warm up shallow waters, making that heat can penetrate deep into sediments under the seafloor.
created by Sam Carana, part of AGU 2011 poster
The initial impact of this methane will be felt most severely in the Arctic itself, given the concentrated and abrupt nature of such releases, with the danger that even relatively small releases of methane from the seafloor of the Arctic can trigger further destabilization of hydrates and further methane releases, escalating into runaway warming.
This danger is depicted in the image on the right, showing how albedo changes and methane releases act as feedbacks that further accelerate warming in the Arctic, eventually spiraling into runaway global warming.
The currently very high sea surface temperature anomalies are illustrated by the two images below.
As the image below right shows, sea surface temperatures as high as 18 degrees Celsius (64.4 degrees Fahrenheit) are currently recorded in the Arctic.
Albedo changes and methane releases are only two out of numerous feedbacks that are accelerating warming in the Arctic.
Also included must be the fact that Earth is in a state of energy imbalance. Earth is receiving more heat from sunlight than it is emitting back into space. Over the past 50 years, the oceans have absorbed about 90% of the total heat added to the climate system, while the rest goes to melting sea and land ice, warming the land surface and warming and moistening the atmosphere.
In a 2005 paper, James Hansen et al. estimated that it would take 25 to 50 years for Earth’s surface temperature to reach 60% of its equilibrium response, in case there would be no further change of atmospheric composition. The authors added that the delay could be as short as ten years.
Earth's waters act as a buffer, delaying the rise in land surface temperatures that would otherwise occur, but this delay could be shortened. Much of that extra ocean heat may enter the atmosphere much sooner, e.g. as part of an El Niño event. Another buffer, Arctic sea ice, could collapse within years, as illustrated by the image below.
[ click on image to enlarge ]
The demise of sea ice comes with huge albedo changes, resulting in more heat getting absorbed by the Arctic Ocean, in turn speeding up warming of the often shallow waters of the Arctic Ocean. This threatens to make heat penetrate subsea sediments containing huge amounts of methane. Abrupt release of large amounts of methane would warm up the Arctic even more, triggering even further methane releases in a spiral of runaway warming.
Particularly worrying is the currently very warm water that is penetrating the Arctic Ocean from the Atlantic Ocean and also from the Pacific Ocean, as illustrated by the image further above and the image on the right.
The danger is that the Arctic will warm rapidly with decline of the snow and ice cover that until now has acted as a buffer absorbing heat, with more sunlight gets absorbed due to albedo changes and as with additional emissions, particularly methane, resulting from accelerating warming in the Arctic.
The numerous feedbacks that accelerate warming in the Arctic are pictured in the image below.
Furthermore, the necessary shift to clean energy will also remove the current masking effect of aerosols emitted when burning fuel. One study finds that a 35% – 80% cut in people's emission of aerosols and their precursors will result in about 1°C of additional global warming.
This is further illustrated by the image below, showing how surface temperature rises are accelerating in the Arctic compared to global rises, with trendlines added including one for runaway global warming, from How many deaths could result from failure to act on climate change?
[ click on image to enlarge ]
The situation is dire and calls for comprehensive and effective action, as discussed at the Climate Plan blog.
Hat tip to Jim Kirkcaldy for pointing at the wildfire development at an early stage.
Is there a mechanism that could make humanity go extinct in the not-too-distant future, i.e. within a handful of decades?
Most people will be aware that emissions due to human activity are causing global warming, as illustrated by the arrow marked 1 in the image on the left. Global warming can cause changes to the land, to vegetation and to the weather. This can result in wildfires that can in turn cause emissions, thus closing the loop and forming a self-reinforcing cycle that progressively makes things worse.
Furthermore, less forests and soil carbon also constitute a decrease in carbon sinks, resulting in carbon that would otherwise have been absorbed by such sinks to instead remain in the atmosphere, thus causing more global warming, as illustrated by the additional downward arrow in the image on the right. In conclusion, there are a number of processes at work that can all reinforce the impact of global warming.
Emissions can also contribute more directly to land degradation, to changes in vegetation and to more extreme weather, as indicated by the additional arrow pointing upward in the image on the right. A recent study by Yuan Wang et al. found that aerosols formed by human activities from fast-growing Asian economies can cause more extreme weather, making storms along the Pacific storm track deeper, stronger, and more intense, while increasing precipitation and poleward heat transport.
Accelerated Warming in the Arctic
Similar developments appear to be taking place over the North Atlantic. Huge pollution clouds from North America are moving over the North Atlantic as the Earth spins. In addition, the Gulf Stream carries ever warmer water into the Arctic Ocean. As the image below shows, sea surface temperature anomalies at the highest end of the scale (8 degrees Celsius) are visible off the coast of North America, streching out all the way into the Arctic Ocean.
As said, feedbacks as are making the situation progressively worse. Feedback loops are causing warming in the Arctic to accelerate. Warming in the Arctic is accelerating with the demise of the snow and ice cover in the Arctic, and this is only feedback #1 out out many feedbacks that are hitting the Arctic, as described in an earlier post. As the temperature difference between the equator and the Arctic decreases, the Jet Stream is changing, making it easier for cold air to move out of the Arctic and for warm air from lower latitudes to move in (feedback #10).
Abrupt Climate Change leading to Extinction at Massive Scale
The danger is that, as temperatures over the Arctic Ocean warm up further and as the Gulf Stream carries ever warmer water into the Arctic Ocean, large quantitities of methane will erupt abruptly from the seafloor of the Arctic Ocean, adding a third kind of warming, runaway warming resulting in abrupt climate change, and leading to mass death, destruction and extiction of species including humans.
Persistence of such a progression makes it inevitable that the rest of Earth will follow the huge temperature rises in the Arctic. Massive wildfires will first ignite across higher latitudes, adding further greenhouse gas emissions and causing large deposits of soot on the remaining snow and ice on Earth, with a huge veil of methane eventually spreading around the globe. The poster below, from an earlier post, illustrates the danger.
[ click on image to enlarge - note that this is a 1.8 MB file that may take some time to fully load ]
Views by Contributors
How likely is it that the above mechanism will cause human extinction within the next few decades? What views do the various contributors to the Arctic-news blog have on this?
Guy McPherson has long argued that, given the strengths of the combined feedbacks and given the lack of political will to take action, near-term human extinction is virtually inevitable.
Further contributors are invited to have their views added to this post as well. While many contributors may largely share Paul Beckwith's comments, it's important to highlight that contributors each have their own views, and this extends to their preference for a specific plan of action.
Geo-engineering
One of the more controversial issues is the use of geo-engineering. Guy McPherson doesn't believe geo-engineering will be successful. In the video below, Paul Beckwith gives his (more positive) views on this.
I must admit that the lack of political will to act is rather depressing, especially given the huge challenges ahead. So, I can understand that this can make some of us pessimistic at times. Nonetheless, I am an optimist at heart and I am convinced that we can get it right by giving more support to a Climate Plan that is both comprehensive and effective, as discussed at ClimatePlan.blogspot.com
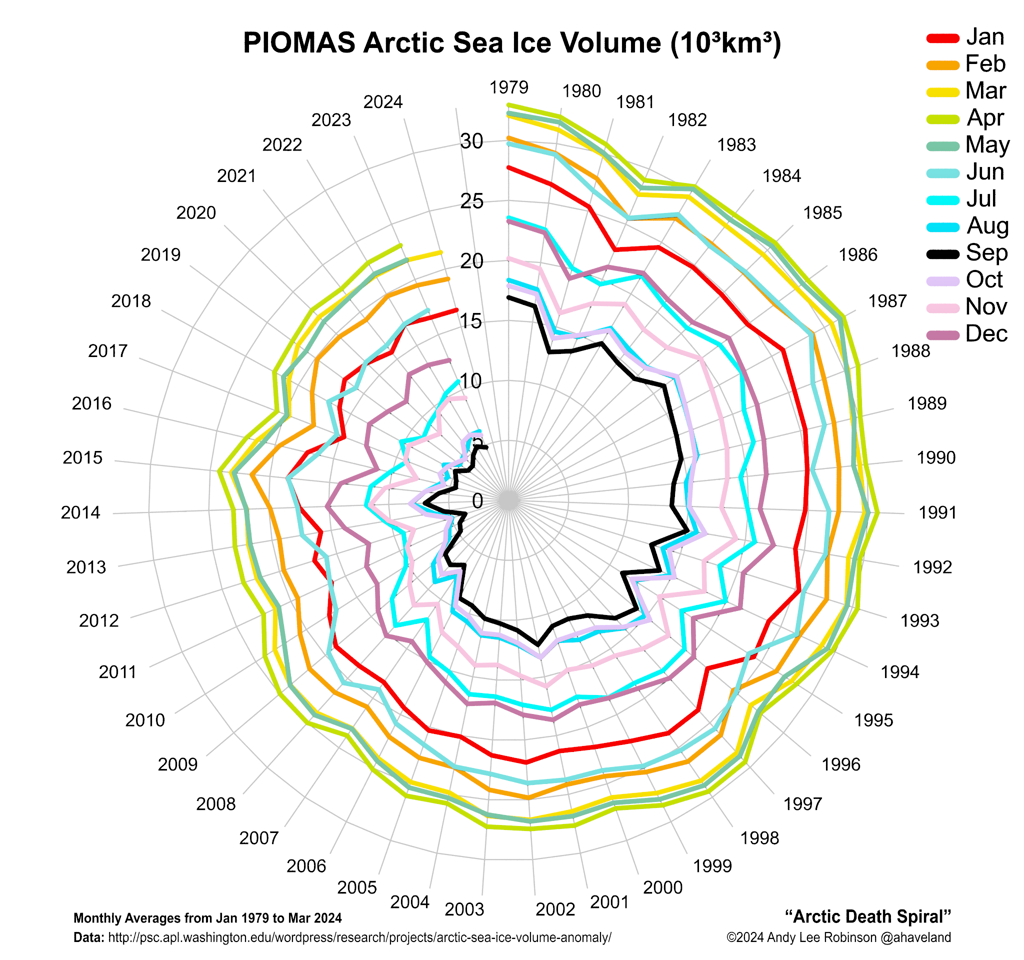
The March 2014 Arctic sea ice volume, as calculated by the Pan-Arctic Ice Ocean Modeling and Assimilation System (PIOMAS) at the Polar Science Center, was the 2nd lowest on record at 21.818 km³. Only March 2011 had a lower volume, at 21.421 km³, as illustrated by the graph below, by Wipneus.
This puts the sea ice in a very weak position. This month, the sea ice will reach its highest volume, which may well be the lowest volume on record for April. The Naval Reserach Laboratory 30-day animation below shows recent sea ice thickness.
The lowest sea ice volume for 2014 is expected to be reached in September, and - given the shape the ice is in now - will likely be one of the lowest minima on record. In fact, there is a chance that there will be no ice left whatsoever later this year. As illustrated by the image below, again by Wipneus, an exponential curve based on annual minima from 1979 points at zero ice volume end 2016, with the lower limit of the 95% confidence interval pointing at zero ice end of 2014.
Absence of sea ice will mean that a lot of more heat will be absorbed by the Arctic Ocean.
As NSIDC.org describes, sea ice reflects 50% to 70% of the incoming energy, but thick sea ice covered with snow reflects as much as 90% of the incoming solar radiation. After the snow begins to melt, and because shallow melt ponds have an albedo of approximately 0.2 to 0.4, the surface albedo drops to about 0.75. As melt ponds grow and deepen, the surface albedo can drop to 0.15. The ocean reflects only 6% of the incoming solar radiation and absorbs the rest. Furthermore, all the heat that during the melt went into transforming ice into water will - in the absence of ice - be absorbed by the ocean as well.
Such feedbacks are causing warming to accelerate in the Arctic Ocean, much of which is very shallow and thus vulnerable to warming. The Gulf Stream can be expected to keep carrying warmer water into the Arctic Ocean. Extreme weather events such as heatwaves and cyclones could make the situation a lot worse.
Warming of the Arctic Ocean threatens to destabilize huge amounts of methane held in sediments at the seafloor, in the form of free gas and hydrates. The danger is that release of methane from the seafloor of the Arctic Ocean will warm up the Arctic even further, triggering even more methane releases, as well as heatwaves, wildfires and further feedbacks, in a spiral of runaway warming that will lead to starvation, destruction and extintion at massive scale across the globe.
In conclusion, the situation is dire and calls for comprehensive and effective action, as discussed at the climate plan blog.
Flooding in Colorado has caused at least five death. As of 14 September, more than 500 were unaccounted for. Nearly 19,000 homes are damaged or destroyed.
Total destruction. Roads. Homes. Power lines. Water pipelines. Sewer culverts and pipes. And an oil pipeline. Not to mention the lives lost and disrupted forever.
Just be glad that the oil pipeline was not something like Keystone XL or Line 9 or Line 6.
Wake up people. Isn't it ironic that extreme weather events are accelerating in frequency, magnitude, spatial extent, and duration and are due to the very abrupt climate change that is being rapidly worsened from fossil fuel emissions; from burning the very stuff that is carried by the oil pipeline infrastructure.
And politicians are either very stupid or simply slaves to the fossil fuel companies since they ignore all laws protecting the environment, and even rewrite the legal system to eliminate any laws that slow or prevent pipelines, tar sands, fracking and any other fossil fuel infrastructure from being built. While publishing outright lies slamming renewable energy.
No wonder police forces across the world are becoming branches of the military; they realize that the public will soon be furious at the politicians and corporations and government corruption at all levels.
Meanwhile, according to the dailymail leaked IPCC reports say that "Global warming is just HALF what we said". So, what's going on? For starters, it appears that the IPCC has been fooled into ignoring the dangerous situation in the Arctic, i.e. albedo changes, methane and further feedbacks. The cartoon below illustrates this, please comment and share widely!