Showing posts with label ocean. Show all posts

Friday, March 27, 2015

Methane Levels Early 2015


The image below shows highest mean methane readings on one day, i.e. March 10, compared between three years, i.e. 2013, 2014 and 2015, at selected altitudes. The comparison indicates that the increase of methane in the atmosphere is accelerating, especially at higher altitudes.


The table below shows the altitude equivalents in mb (millibar) and feet.

56925 feet44689 feet36850 feet30569 feet25543 feet19819 feet14383 feet8367 feet1916 feet
74 mb147 mb218 mb293 mb367 mb469 mb586 mb742 mb945 mb

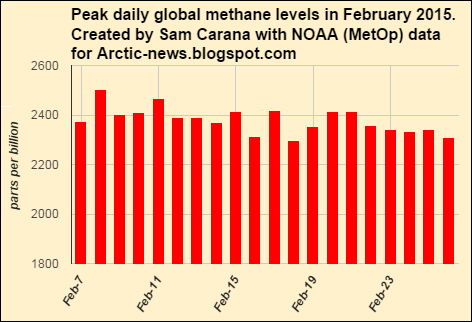
This rise in global mean methane levels appears to go hand in hand with much higher peak readings, especially at higher altitudes.


From January 1 to March 20, 2015, methane levels reached levels as high as 2619 ppb (on January 12, 2015), while peak daily levels averaged 2373 parts per billion (ppb). At the start of the year, global mean methane levels typically reach their lowest point, while highest mean levels are typically reached in September. Highest daily global mean methane levels for the period from January 1, 2015, to March 20, 2015, ranged from 1807 ppb (January 6, 2015) to 1827 ppb (March 5, 2015).

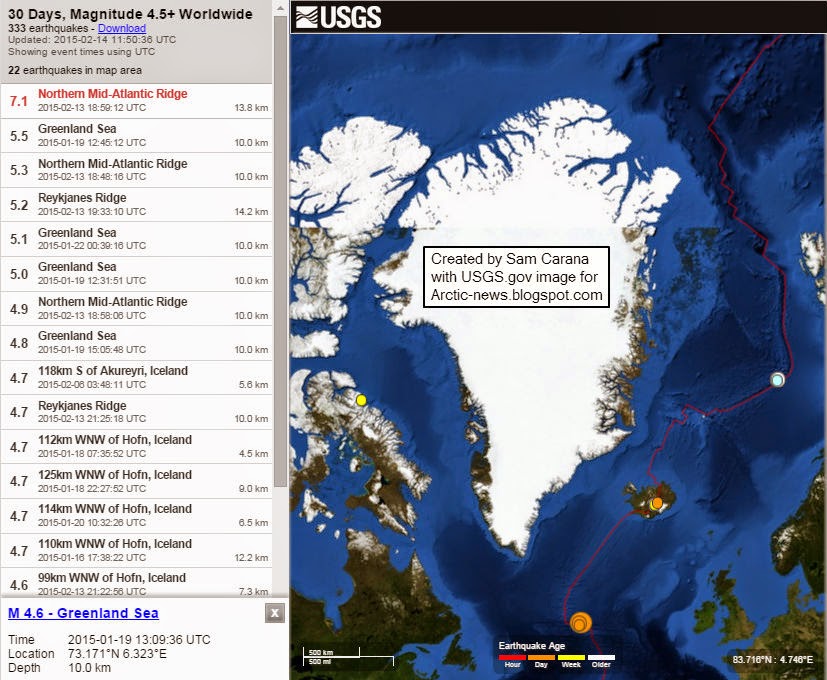
Further study of the locations with high methane levels indicates that much of the additional methane appears to originate from releases at higher latitudes of the Northern Hemisphere, in particular from the Arctic Ocean, from where it is over time descending toward the equator (methane will typically move closer to the equator over time as it rises in altitude, as discussed in this earlier post).

The largest source of additional methane appears to be emissions from the seabed of the Arctic Ocean. Annual emissions from hydrates were estimated to amount to 99 Tg annually in a 2014  post (image below).


The image below, based on data from the IPCC and the World Metereological Organization (WMO), with an added observation from a NOAA MetOp satellite image, illustrates the recent rise of methane levels and the threat that methane levels will continue to rise rapidly.


What causes these methane eruptions?

Methane eruptions from the seafloor of the Arctic Ocean appear to be primarily caused by rising ocean heat that is carried by the Gulf Stream into the Arctic Ocean. The image below shows sea surface temperatures of 20.9°C (69.62°F, green circle left) recorded off the coast of North America on March 14, 2015, an anomaly of 12.3°C (36.54°F).

[ click on image to enlarge ]
Furthermore, both methane eruptions from the Arctic Ocean seafloor and demise of the Arctic sea ice and snow cover are feedbacks that can interact and amplify each other in non-linear ways, resulting in rapid and intense temperature rises, as illustrated by the image below.

Diagram of Doom - for more background, see Feedbacks
How high could temperatures rise?

Worryingly, a non-linear trend is also contained in the temperature data that NASA has gathered over the years, as described in an earlier post. A polynomial trendline points at global temperature anomalies of over 4°C by 2060. Even worse, a polynomial trend for the Arctic shows temperature anomalies of over 4°C by 2020, 6°C by 2030 and 15°C by 2050, threatening to cause major feedbacks to kick in, including albedo changes and methane releases that will trigger runaway global warming that looks set to eventually catch up with accelerated warming in the Arctic and result in global temperature anomalies of 16°C by 2052.

[ click on image to enlarge ]
Action

The situation is dire and calls for comprehensive and effective action, as discussed at the Climate Plan blog.


Comparison between three years, i.e. 2013, 2014 and 2015, of highest mean methane readings at selected altitudes on...
Posted by Sam Carana on Friday, March 27, 2015

Saturday, February 28, 2015

The Mechanism

What is the mechanism behind accelerated warming of the Arctic Ocean, huge abrupt methane eruptions from the seafloor of the Arctic Ocean and skyrocketing temperatures?


1. Potential for Methane Release in Arctic

Vast amounts of methane are stored in hydrates under the seafloor of the Arctic Ocean. Furthermore, vast amounts of methane in the form of free gas are contained in sediments under the seafloor of the Arctic Ocean. Thirdly, vast amounts of carbon are frozen in the permafrost and much may enter the atmosphere in the form of methane as the permafrost copntinues to melt.

Natalia Shakhova et al. in 2010 estimated the accumulated potential for the East Siberian Arctic Shelf (ESAS) region alone (image on the right) as follows:
- organic carbon in permafrost of about 500 Gt
- about 1000 Gt in hydrate deposits
- about 700 Gt in free gas beneath the gas hydrate stability zone.

In early 2014, Sam Carana estimated annual methane emissions from hydrates and permafrost at 100 Tg (i.e. 0.1 Gt). This methane will contribute to further warming of the air over the Arctic and the North Atlantic, causing further further extreme weather events, such as heatwaves and storms along the path of the Gulf Stream from the North Atlantic into the Arctic Ocean, in turn triggering further releases from hydrates at the seafloor of the Arctic Ocean and escalating into runaway global warming.


Such methane eruptions are caused by warming water of the Arctic Ocean, which in turn is due to emissions by people. Some elements of the mechanism causing methane to erupt from the seafloor are described in more detail below.

2. Ocean Heat
From: Ocean Temperature Rise continues
Above graph, based on NOAA data, shows a polyomial trendline pointing at a Northern Hemisphere sea surface temperature rise of more than 5°C (9°F) by 2050, compared to the 20th century average, from an earlier post.

Waters at greater depth are also warming rapidly, as illustrated by the image on the right, from an earlier post, showing a rise in ocean heat up to 2000 m deep that has more than doubled over the past decade. Data from 2005 through to 2014 conatain a polynomial trendline that points at a similar rise by 2017, followed by an even steeper rise.

The North Atlantic is warming rapidly, with sea surface temperature anomalies as high as a 12°C (21.6°F) recorded east of North America earlier this year, as illustrated by the image below.

A warmer North Atlantic is a major contributor to the rapidly warming waters of the Arctic Ocean, since the Gulf Stream keeps carrying warmer water into the Arctic Ocean all year long.

A further contributor is a warmer North Pacific.

Further contributions come from the combined impact of numerous feedbacks, in particular changing winds and currents, cryosphere changes and methane releases, as further described below.

From: Watch where the wind blows

3. Feedbacks: Changing Winds and Currents, Cryosphere Changes and Methane

- Changed Winds and Currents

Emissions by people are not only causing temperatures of the atmosphere and oceans to rise, they are also causing winds and ocean currents to change. Such changes can in turn result in heatwaves that are more intense and that persist for prolonged periods. Furthermore, strong northbound winds, combined with strong precipitation and waves can speed up the volume of warm water carried by Gulf Stream into the Arctic Ocean, as discussed in an earlier post

- Arctic Sea Ice

A warming atmosphere, warming oceans and decline of the Arctic snow and ice cover all go hand in hand. The IPCC concluded in AR5 that, for RCP8.5, the Arctic Ocean will likely be nearly ice-free in September before mid-century. Prof. Peter Wadhams warned, back in 2012, that the Arctic Ocean could be virtually ice-free within a few years. An exponential trendline based on sea ice volume observations shows that sea ice looks set to disappear in 2019, while disappearance in 2015 is within the margins of a 5% confidence interval, reflecting natural variability, as discussed at the FAQ page.


- Permafrost

Permafrost decline will cause Arctic temperatures to rise, due to albedo change and due to carbon that is contained in the permafrost and that can be expected to be released in the form of methane or carbon dioxide as the permafrost melts. The image below pictures permafrost decline as foreseen by the IPCC in AR5. 


Obviously, rapid decline of the sea ice will come with albedo changes that will also make the permafrost decline more strongly than the IPCC foresees, while they will also cause even more extreme weather events. One of the dangers is that huge amounts of warmer water will flow from rivers into the Arctic Ocean, as discussed below.

- Warmer Water From Rivers

More sunlights getting absorbed in the Arctic will accelerate warming of the Arctic Ocean directly, while there will also be warmer water flowing into the Arctic Ocean from rivers in Siberia and North America, fueled by stronger and longer heatwaves, storms and wildfires. 

map from: http://en.wikipedia.org/wiki/File:Rs-map.png
Above map shows that a number of large rivers in Siberia end up in the Arctic Ocean. Another large river is the Mackenzie River, which ends in the Beaufort Sea, north of Alaska, where sea surface temperatures of about 20°C (68°F) were recorded in 2013, as the image below illustrates.


Another area of concern, also marked with a purple oval in the image below, is located in the north of Canada.


More extreme weather events include heat waves, storms, floods and wildfires, all of which can contribute to more rapid warming of the Arctic Ocean.

The combined effect of all the above will be that methane that is now contained in the form of free gas and hydrates in sediments under the Arctic Ocean, can be expected to be increasingly released as the Arctic Ocean warms further.

- Methane 

Of the vast amounts of methane stored in the Arctic, much of it is prone to be released with further temperature rises, as discussed in this earlier post and in this earlier post. Cracks in sediments used to be filled with ice. Warmer water is now melting the ice that used to sit in cracks. This ice has until now acted as a glue, holding the sediment together. Moreover, the ice in the cracks has until now acted as a barrier, a seal, that prevented the methane contained in those sediments from escaping. In a video interview with Nick Breeze, Natalia Shakhova mentions a sample of sediment taken from the ESAS seafloor in 2011 that turned out to be ice-free to a depth of 53 m at water temperatures varying from -0.6˚C to -1.3˚C. Back in 2008, Natalia Shakhova et al. considered release of up to 50 Gt of predicted amount of hydrate storage as highly possible for abrupt release at any time.

The image below, based on data from the IPCC and the World Metereological Organization (WMO), with an added observation from a NOAA MetOp satellite image, illustrates the recent rise of methane levels and the threat that methane levels will continue to rise rapidly.


When looked at from a longer range of years, above image fits in the black square on the image below.


The image below shows exponential rise based on data of East Siberian Arctic Shelf (ESAS) releases alone, as discussed in an earlier post.


Non-linear rise is supported by the fact that methane's lifetime increases as more methane enters the atmosphere. As the image below shows, peak methane levels have been very high recently.


All these feedbacks can interact and amplify each other in non-linear ways, resulting in rapid and intense temperature rises, as illustrated by the image below.

Diagram of Doom - for more background, see Feedbacks

4. Runaway Global Warming

The threat is that such rapid temperature rises will appear at first in hotspots over the Arctic and eventually around the globe, while also resulting in huge temperature swings that could result in depletion of supply of food and fresh water, as further illustrated by the above image, from an earlier post, and the image below, from another earlier post.

Rapidly rising temperatures will cause stronger evaporation of sea water. Since water vapor is one of the strongest greenhouse gases, this can further contribute to the non-linear temperature rises pictured above.

In conclusion, the situation is dire and calls for comprehensive and effective action, as discussed at the Climate Plan blog.


Sunday, February 22, 2015

Multiple Benefits Of Ocean Tunnels

By Sam Carana and Patrick McNulty

Comprehensive climate action will do more than just cutting emissions, it will also take further action, as pictured in the image below.

Comprehensive and effective action is discussed at the Climate Plan blog
Taking a broad perspective makes it easier for proposed projects to be assessed on their benefits in a multitude of areas.

Ocean tunnels can capture vast amounts of energy from ocean currents, such as the Gulf Stream and the Kuroshio Current. These locations are close to areas with high energy demand, such as the North American East Coast and the coast of East Asia, which can reduce the need for long distance transmission lines.

Ocean tunnels provide clean energy continuously, i.e. 24 hours a day, all year long. This makes that they can satisfy demand for electricity both at peak and off-peak usage times.

  • Their ability to supply large amounts of electricity at times of peak demand will benefit the necessary transition from polluting to clean ways of generating electricity.
  • Their ability to also supply large amounts of electricity at off-peak usage times will help to reduce the price of electricity at such times, thus opening up opportunities for a number of activities that can take place at off-peak hours and that require large amounts of energy.

    Such activities include large-scale grinding of olivine rock and transport of the resulting olivine sand, and large-scale production of hydrogen through electrolysis to power transport (box right). Electrolysis can also create oxygen-enriched water that can improve the quality of waters that are oxygen-depleted.  
Hydrogen to power Shipping

Ocean tunnels can make electricity cheap at off-peak times. This will reduce the cost of recharging batteries of electric vehicles at night.

It will also reduce the cost of producing hydrogen at off-peak hours. To power ships crossing the oceans, hydrogen looks more cost-effective, as such ships cannot return to base for a nighly battery recharge. Such ships have plenty of cargo space to carry hydrogen, even when the hydrogen is not highly compressed. Some of the world's largest ports are close to strong ocean currents.


Ocean tunnels can generate electricity in two ways, i.e. by capturing the kinetic energy contained in the flow of ocean currents, and by means of Ocean Thermal Energy Conversion (OTEC) using temperature differences between cooler deeper parts of the ocean and warmer surface waters to run a heat engine to produce energy. 

Besides generating energy, ocean tunnels can assist with further activities, which will increase the value of ocean tunnels in the fight against climate change. Such activities include the following:
  • By reaching deeper parts of the ocean, OTEC can pull up sunken nutrients and put them out at surface level to fertilize the waters there, while the colder water that is the output of OTEC will float down, taking along newly-grown plankton to the ocean depths before it can revert to CO2, as described in the earlier post Using the Oceans to Remove CO2 from the Atmosphere.
  • Ocean tunnels can be used to distribute olivine sand in the water. The force of the currents and the turbines will help the process of transforming olivine into bicarbonate. This can reduce carbon dioxide levels in the water by sequestering carbon, while also reducing ocean acidification. Olivine sand contains silicate and small amounts of iron, allowing diatoms to grow that will capture additional carbon dioxide, while also raising levels of free oxygen in the water. The latter will stimulate growth of microbes that break down methane in the water before it reaches the atmosphere. Further nutrients can be added, as also discussed in this earlier post
  • Ocean tunnels can also assist with albedo changes. Ocean tunnels can act as the infrastructure to create water microbubbles along their track. Increasing water albedo in this way can reduce solar energy absorption by as much as 100 W m − 2, potentially reducing equilibrium temperatures of standing water bodies by several Kelvins, as Russel Seitz wrote back in 2010. There may also be potential for ocean tunnels to be used to spray water vapor into the air with the aim of brightening clouds over areas where it counts most.
  • The turbines in tunnels will also reduce the flow of ocean currents somewhat, thus reducing the flow of warm water into the Arctic. Furthermore, tunnels can be shaped in ways to guide the flow of warm water away from the Arctic Ocean down a southwards course along the Canary Current along the coast of West Africa. thus diverting warm water that would otherwise end up in the Arctic Ocean. This could also reduce the chance of hurricanes hitting the east coast of North America, as Sandy did in 2012.  
The Gulf Stream, carrying warm water all the way into the Arctic Ocean


Monday, February 16, 2015

Climate Changed

Our climate has changed, as illustrated by the image below (Forecast for Feb. 23, 2015, 1200 UTC, run on Feb. 16, 2015).


The left map shows temperatures of 40 degrees below zero moving down into North America from the Arctic, while temperatures in much of Alaska are above freezing point. The right map shows temperature anomalies over large parts of North America at both the top end (red) and the bottom end (purple) of the scale. Temperature anomaly forecasts for the week from Feb 19 to 26, 2015, feature in the video below.


Below is an update showing operational temperature anomalies recorded on February 23, 2015.


As parts of North America experienced record cold, part of Alaska was more than 20°C (36°F)
warmer than it used to be (compared to 1985-1996). And despite the cold weather in parts of Canada and Greenland, the Arctic as a whole is forecast to reach, on February 26, temperature anomalies as much as 3.32°C (6°F) above what temperatures used to be from 1979 to 2000 (Climate Reanalyzer forecast data).

What has caused our climate to change in this way? The image below shows that the jet stream, which once used to move over North America horizontally, has become more wavy, pushing warm air north on the left, while drawing cold air from the Arctic south on the right.


Importantly, while the jet stream is becoming more wavy or elongated vertically, the speed at which it crosses the oceans can increase dramatically. This can be the case where low temperatures over land and high sea surface temperatures combine to create huge temperature differences that drive up the jet stream's speed over oceans.

This is illustrated by the image below showing the Jet Stream reaching speeds as high as 410 km/h (or 255 mph) at the green circle near Greenland on January 9, 2015 (left), and speeds as high as 403 km/h (or 250 mph) at the green circle near Greenland on February 20, 2015 (right).


The reference map on the right shows the location of the continents for the same orthgraphic coordinates as the maps above and below.

Similarly, the Polar Vortex can reach high speeds, driving cold air downward over North America and driving warm air upward over Greenland and the North Atlantic.

The image below shows the Polar Vortex reaching speeds as high as 346 km/h (or 215 mph) at the green circle near Svalbard on January 18, 2015 (left), and speeds as high as 316 km/h (or 196.4 mph) at the green circle over the Arctic Ocean on February 9, 2015 (right).


Almost one year ago, the Polar Vortex also reached speeds as high as 410 km/h (or 255 mph), as discussed in an earlier post. Changes to the polar vortex and the jet stream are caused by emissions, and the situation looks set to deteriorate even further.


Above image illustrates that, on February 16, 2015, waves higher than 10 m (32.81 ft) were recorded off the east coast of North America and south of Iceland, while waves as high as 8.15 m (26.74 ft) were recorded in between Norway and Svalbard.

As above images also illustrate, changed wind patterns are carrying warm air high up into the Arctic.

The air that is moving north is much warmer than it used to be, as sea surface temperatures off the east coast of North America are much higher than they used to be (image left and as discussed in an earlier post).

Strong winds increase the volume of warm water that the Gulf Stream carries into the Arctic Ocean. They can also cause rain storms that can devastate Arctic ice and glaciers

Arctic sea ice currently has about the lowest extent for the time of the year since satellite measurements started in 1979.

The image below shows that, on February 17, 2015, Arctic sea ice had reached an extent of merely 14.406 million square kilometers.

click on image to enlarge
The Arctic sea-ice Monitor image below shows an extent of 13,774,725 km2 for February 18, 2015, with the red line illustrating the recent fall in extent even more dramatically.

Below is a 30-day animation showing sea ice thickness (in m) up to February 22, 2015 (and forecast up to March 2), from the U.S. Naval Research Laboratory.


As the Arctic's snow and ice cover decline, more sunlight gets absorbed that previously was reflected back into space. All this adds up to a very dangerous situation, since huge amounts of methane are contained in sediments under the seafloor of the Arctic Ocean, and they can get destabilized as the water warms up.

In conclusion, feedbacks make that the Arctic is warming more rapidly than the rest of the globe and they threaten to trigger huge methane eruptions from the seafloor of the Arctic Ocean.

Methane concentrations over the Arctic Ocean are very high at the moment. The image below shows the very high peak methane levels that have recently been recorded, against a background image showing high methane levels over the East Siberian Arctic Shelf on February 20, 2015.


The situation is dire and calls for comprehensive and effective action, as discussed at the Climate Plan blog.


Thursday, February 12, 2015

Something had to give - Baffin Island hit by M4.6 earthquake

An earthquake with a magnitude of 4.6 on the Richter scale hit Baffin Island on February 12, 2015, at 02:11:40 (UTC). The image below, from the United States Geological Survey (USGS), shows the epicenter of the quake.


The earthquake occurred at a time when surface temperature anomalies over parts of North America and Greenland are at the bottom end of the scale, while surface temperature anomalies over parts of Siberia are at the top end of the scale, as illustrated by the image below.


The image below shows pressure differences reaching the top and bottom ends of the scale (left). At the same time, sea surface temperature anomalies around North America and Greenland are at the top end of the scale (right). It appears that something had to give. 


This earthquake is important, given that it hit an area without large faultlines (though earthquakes are common here, also see this discussion). The Baffin Island earthquake occurred in an area prone to glacial isostatic adjustment, as illustrated by the image below.

From "http://grace.jpl.nasa.gov", (unfiltered version). Credit: A, G., J. Wahr, and S. Zhong (2013) "Computations
of the viscoelastic response of a 3-D compressible Earth to surface loading: an application to Glacial Isostatic
Adjustment in Antarctica and Canada", Geophys. J. Int., 192, 557–572, doi: 10.1093/gji/ggs030
Glacial isostatic adjustment as a phenomenon takes place over relatively long periods. An additional problem is extreme weather events influencing the occurence of earthquakes more immediately.

Here's an update on the situation. Five earthquakes occured on February 13, 2015, close together, including a magnitude 7.1 at the Northern Mid-Atlantic Ridge, south of Greenland:
- M5.3 Northern Mid-Atlantic Ridge 2015-02-13 18:48:16 UTC 10.0 km
- M4.9 Northern Mid-Atlantic Ridge 2015-02-13 18:58:06 UTC 10.0 km
- M7.1 Northern Mid-Atlantic Ridge 2015-02-13 18:59:12 UTC 13.8 km
- M4.7 Reykjanes Ridge 2015-02-13 21:25:18 UTC 10.0 km
- M5.2 Reykjanes Ridge 2015-02-13 19:33:10 UTC 14.2 km

This M7.1 is the largest earthquake to hit the area around Greenland in a decade or more. And it's not just this one that has recently hit the area. The image below shows the recent Baffin Island quake in yellow, and the earthquakes that occurred today at the Northern Mid-Atlantic Ridge in orange. Furthermore, there are recent quakes on Iceland in orange and yellow. There were also three large earthquakes in the Greenland Sea, the 4.6 one is highlighted in blue (otherwise it would have been hidden).


The image below gives an impression of extreme weather events on February 13-14, 2015. 


Boston has meanwhile run out of room to dump snow, while roofs have collapsed in Massachusetts under the weight of the snow. Lnks between extreme weather events and earthquakes have been discussed before. Extreme weather events look set to intensify as temperatures in the Arctic keep rising. This is very worrying, given the vulnerability of methane under the seafloor of the Arctic Ocean. Furthermore, there are also indications that methane could be released from Greenland due to sequences of strong compaction and expansion of the snow and ice cover, due to extreme weather events. 

High methane levels have recently been recorded in the atmosphere over the Arctic Ocean, including over Baffin Bay.


Methane is present in sediments under the Arctic Ocean in the form of free gas and hydrates. Earthquakes can send out strong tremors through the sediment and shockwaves through the water, which can trigger further earthquakes, landslides and destabilization of methane hydrates.

As temperatures in the Arctic keep rising, the jet streams and polar vortex are changing their shape, in particular becoming more wavy, which can cause more extreme weather events such as the events described above.

The situation is dire and calls for comprehensive and effective action, as discussed at the Climate Plan blog


Tuesday, February 3, 2015

Watch where the wind blows

The Arctic looks set to be pummeled by strong winds on February 5, 2015, as shown by the Climate Reanalyzer forecast below.


The video below, based on Climate Reanalyzer images, watch the situation unfold over a period of 9 days


Strong winds can increase the transport of warm water into the Arctic Ocean by the Gulf Stream. The video shows strong winds repeatedly developing off the North American east coast and moving along the path of the Gulf Stream, all the way into the Arctic Ocean, all in a matter of days.

Emissions are causing greater warming of the Gulf Stream and the Arctic. As a result, there is less temperature difference between the equator and the Arctic, slowing down the speed at which the jet streams circumnavigate the globe, while the jets can also become wavier, which in turn can cause extreme weather events.

In this case, what fuels these winds is the temperature difference between an area off the east coast of North America where temperatures are much higher than they used to be on the one hand, and an area in Siberia where temperatures are extremely low on the other hand. Wind flows from a warm area to a cold area, and the greater the temperature difference, the stronger the wind will blow.

The image below shows that, on February 3rd, 2015, a sea surface temperature of 21°C (69.8°F) was recorded off the east coast of North America (green circle), which constitutes a 12°C (21.6°F) anomaly. Anomalies as high as 12°C were also recorded on February 4, 2015.

click on image to enlarge
Changes to the jet streams can thus fuel strong winds, and such winds can bring warmer air into the atmosphere over the Arctic Ocean. On February 5, 2015, surface temperatures over a large part of the Arctic Ocean were more than 20°C (36°F) warmer compared to what they were from 1985 to 1996.


Extreme weather events, as a result of changes to the jet streams and polar vortex, are depicted as feedback #19 in the diagram below, while storms that bring warmer air into the atmosphere over the Arctic Ocean are depicted as feedback #5,

Besides increasing the transport of warm water into the Arctic Ocean and bringing warmer air into the atmosphere over the Arctic Ocean, strong winds can also break up the sea ice by sheer brute force of the waves caused by the wind.

Waves as high as 10.61 m (34.81 ft) were recorded south of Greenland on February 4, 2015, while waves as high as 7.05 m (23.13 ft) were recorded on the edge of the Arctic sea ice (east of Svalbard) on February 5, 2015, as shown on the combination image below.


Waves that break up the sea ice into smaller pieces can speed up melting, especially in summer. More wind also means more water evaporation, and warmer air holds more water vapor, so this can result in huge rainstorms that can rapidly devastate the integrity of the ice. Strong winds thus constitute a feedback that can result in more open waters in the Arctic Ocean (feedback #6 on the diagram below).

Furthermore, strong winds can speed up the currents that will eventually move sea ice out of the Arctic Ocean into the Atlantic Ocean (feedback #7). Wavy waters catch more sunlight than still water (feedback #8). Decline of the Arctic snow and ice cover results in more sunlight being absorbed by the Arctic, thus further heating up the water of the Arctic ocean (feedback #1).

The dual image below, with images from Climate Reanalyzer, shows high sea surface temperatures around North America and at the edges of the Arctic sea ice. This contributes to surface temperatures that are 20°C (36 °F) higher than what they used to be in Eastern Siberia. At the same time, temperatures on land elsewhere in Siberia, on the North Pole and in parts of Canada and Greenland can go down to 40 degrees below zero.


Accelerated warming of the Arctic is changing the jet streams, in turn contributing to the likelyhood that such strong winds will hit the Arctic. The high temperature difference between the hot spot off the North American east coast and the cold spot over Siberia fuels such strong winds. The dual images below show the jet stream's elongated path over Greenland. Accordingly, temperature anomalies in Greenland are reaching the top end of the scale.


The big danger is that such strong winds will warm up the Arctic Ocean and cause huge amounts of methane to erupt from its seafloor.

The image below shows that methane levels as high as 2503 ppb were recorded on January 31, 2015.


Such methane eruptions constitute yet another feedback that further contributes to warming in the Arctic. For more feedbacks, see the image below.

from:  climateplan.blogspot.com/p/feedbacks.html

The situation is dire and calls for comprehensive and effective action, as discussed at the Climate Plan blog.