Showing posts with label anomaly. Show all posts

Friday, March 27, 2015

Methane Levels Early 2015


The image below shows highest mean methane readings on one day, i.e. March 10, compared between three years, i.e. 2013, 2014 and 2015, at selected altitudes. The comparison indicates that the increase of methane in the atmosphere is accelerating, especially at higher altitudes.


The table below shows the altitude equivalents in mb (millibar) and feet.

56925 feet44689 feet36850 feet30569 feet25543 feet19819 feet14383 feet8367 feet1916 feet
74 mb147 mb218 mb293 mb367 mb469 mb586 mb742 mb945 mb

This rise in global mean methane levels appears to go hand in hand with much higher peak readings, especially at higher altitudes.


From January 1 to March 20, 2015, methane levels reached levels as high as 2619 ppb (on January 12, 2015), while peak daily levels averaged 2373 parts per billion (ppb). At the start of the year, global mean methane levels typically reach their lowest point, while highest mean levels are typically reached in September. Highest daily global mean methane levels for the period from January 1, 2015, to March 20, 2015, ranged from 1807 ppb (January 6, 2015) to 1827 ppb (March 5, 2015).

Further study of the locations with high methane levels indicates that much of the additional methane appears to originate from releases at higher latitudes of the Northern Hemisphere, in particular from the Arctic Ocean, from where it is over time descending toward the equator (methane will typically move closer to the equator over time as it rises in altitude, as discussed in this earlier post).

The largest source of additional methane appears to be emissions from the seabed of the Arctic Ocean. Annual emissions from hydrates were estimated to amount to 99 Tg annually in a 2014  post (image below).


The image below, based on data from the IPCC and the World Metereological Organization (WMO), with an added observation from a NOAA MetOp satellite image, illustrates the recent rise of methane levels and the threat that methane levels will continue to rise rapidly.


What causes these methane eruptions?

Methane eruptions from the seafloor of the Arctic Ocean appear to be primarily caused by rising ocean heat that is carried by the Gulf Stream into the Arctic Ocean. The image below shows sea surface temperatures of 20.9°C (69.62°F, green circle left) recorded off the coast of North America on March 14, 2015, an anomaly of 12.3°C (36.54°F).

[ click on image to enlarge ]
Furthermore, both methane eruptions from the Arctic Ocean seafloor and demise of the Arctic sea ice and snow cover are feedbacks that can interact and amplify each other in non-linear ways, resulting in rapid and intense temperature rises, as illustrated by the image below.

Diagram of Doom - for more background, see Feedbacks
How high could temperatures rise?

Worryingly, a non-linear trend is also contained in the temperature data that NASA has gathered over the years, as described in an earlier post. A polynomial trendline points at global temperature anomalies of over 4°C by 2060. Even worse, a polynomial trend for the Arctic shows temperature anomalies of over 4°C by 2020, 6°C by 2030 and 15°C by 2050, threatening to cause major feedbacks to kick in, including albedo changes and methane releases that will trigger runaway global warming that looks set to eventually catch up with accelerated warming in the Arctic and result in global temperature anomalies of 16°C by 2052.

[ click on image to enlarge ]
Action

The situation is dire and calls for comprehensive and effective action, as discussed at the Climate Plan blog.


Comparison between three years, i.e. 2013, 2014 and 2015, of highest mean methane readings at selected altitudes on...
Posted by Sam Carana on Friday, March 27, 2015

Friday, March 6, 2015

March 4, 2015 - Arctic Sea Ice Extent Hits Record Low

Sea surface temperature anomalies as high as 12°C (21.6°F) recorded off the east coast of North America have been described earlier, in he post 'Watch where the wind blows'. The Jet Stream reaching high speeds has also been described earlier, in the post 'Climate Changed'.


As feared, this is pushing warm water, water vapor and air from the North Atlantic into the Arctic Ocean. The three images below show forecasts for March 8, 2015, of - from top to bottom - the jet stream, surface winds and temperature anomalies.


Above image shows that the Arctic is forecast to reach a temperature anomaly of more than +4 degrees Celsius (more than +7 degrees Fahrenheit) on March 8, 2015, with temperature anomalies at the top end of the scale forecast for most of the Arctic Ocean.

On March 4, 2015, Arctic sea ice extent hit a record low for the time of the year, as illustrated by the image below.


As the March 5, 2015, Naval Research Laboratory image on the right illustrates, there is little scope for Arctic sea ice extent to grow over the next few weeks, since the only areas where it could possibly expand would be the Pacific and the North Atlantic, the very areas that are under pressure from ocean heat and high surface temperatures.

In other words, the situation looks set to deteriorate further.

Huge amounts of heat are still going into melting the sea ice. Furthermore, the sea ice is still able to reflect a lot of sunlight back into space. With continued demise of the snow and ice cover, more and more heat will be absorbed in the Arctic.

The big danger is that warm water will trigger further releases of methane from the seafloor of the Arctic Ocean. Peak daily methane levels recorded in early 2015 averaged a very high 2372 parts per billion, as illustrated by the image below.


Methane extent has been especially high over the Arctic Ocean. The images below are from the earlier post 'Temperature Rise'. The post added that, as the Gulf Stream keeps carrying ever warmer water into the Arctic Ocean, methane gets released in large quantities, as illustrated by the images below showing high methane levels over the East Siberian Arctic Shelf (red oval left) and over Baffin Bay (red oval right) with concentrations as high as 2619 ppb.

click on image to enlarge
The images below show methane levels on Jan 25 (top), and Jan 26, 2015 (bottom).


Update:
Meanwhile, Arctic sea ice extent as reported by NSIDC.org reached a new record low for the time of the year with 14.358 million square km on March 4, 2015, and another record low with 14.308 million square km on March 7, 2015.

Temperature anomaly for the Arctic on March 8, 2015 (daily average) was even higher tha forecast, at +4.26 degrees Celsius, with peaks at +4.37 degrees Celsius.


High waves were registered in the North Atlantic on March 7, 2015, moving into the Arctic Ocean and causing waves more than 4 m high close to the edge of the sea ice on March 8, 2015.


The situation is dire and calls for comprehensive and effective action, as discussed at the Climate Plan blog.


Monday, February 16, 2015

Climate Changed

Our climate has changed, as illustrated by the image below (Forecast for Feb. 23, 2015, 1200 UTC, run on Feb. 16, 2015).


The left map shows temperatures of 40 degrees below zero moving down into North America from the Arctic, while temperatures in much of Alaska are above freezing point. The right map shows temperature anomalies over large parts of North America at both the top end (red) and the bottom end (purple) of the scale. Temperature anomaly forecasts for the week from Feb 19 to 26, 2015, feature in the video below.


Below is an update showing operational temperature anomalies recorded on February 23, 2015.


As parts of North America experienced record cold, part of Alaska was more than 20°C (36°F)
warmer than it used to be (compared to 1985-1996). And despite the cold weather in parts of Canada and Greenland, the Arctic as a whole is forecast to reach, on February 26, temperature anomalies as much as 3.32°C (6°F) above what temperatures used to be from 1979 to 2000 (Climate Reanalyzer forecast data).

What has caused our climate to change in this way? The image below shows that the jet stream, which once used to move over North America horizontally, has become more wavy, pushing warm air north on the left, while drawing cold air from the Arctic south on the right.


Importantly, while the jet stream is becoming more wavy or elongated vertically, the speed at which it crosses the oceans can increase dramatically. This can be the case where low temperatures over land and high sea surface temperatures combine to create huge temperature differences that drive up the jet stream's speed over oceans.

This is illustrated by the image below showing the Jet Stream reaching speeds as high as 410 km/h (or 255 mph) at the green circle near Greenland on January 9, 2015 (left), and speeds as high as 403 km/h (or 250 mph) at the green circle near Greenland on February 20, 2015 (right).


The reference map on the right shows the location of the continents for the same orthgraphic coordinates as the maps above and below.

Similarly, the Polar Vortex can reach high speeds, driving cold air downward over North America and driving warm air upward over Greenland and the North Atlantic.

The image below shows the Polar Vortex reaching speeds as high as 346 km/h (or 215 mph) at the green circle near Svalbard on January 18, 2015 (left), and speeds as high as 316 km/h (or 196.4 mph) at the green circle over the Arctic Ocean on February 9, 2015 (right).


Almost one year ago, the Polar Vortex also reached speeds as high as 410 km/h (or 255 mph), as discussed in an earlier post. Changes to the polar vortex and the jet stream are caused by emissions, and the situation looks set to deteriorate even further.


Above image illustrates that, on February 16, 2015, waves higher than 10 m (32.81 ft) were recorded off the east coast of North America and south of Iceland, while waves as high as 8.15 m (26.74 ft) were recorded in between Norway and Svalbard.

As above images also illustrate, changed wind patterns are carrying warm air high up into the Arctic.

The air that is moving north is much warmer than it used to be, as sea surface temperatures off the east coast of North America are much higher than they used to be (image left and as discussed in an earlier post).

Strong winds increase the volume of warm water that the Gulf Stream carries into the Arctic Ocean. They can also cause rain storms that can devastate Arctic ice and glaciers

Arctic sea ice currently has about the lowest extent for the time of the year since satellite measurements started in 1979.

The image below shows that, on February 17, 2015, Arctic sea ice had reached an extent of merely 14.406 million square kilometers.

click on image to enlarge
The Arctic sea-ice Monitor image below shows an extent of 13,774,725 km2 for February 18, 2015, with the red line illustrating the recent fall in extent even more dramatically.

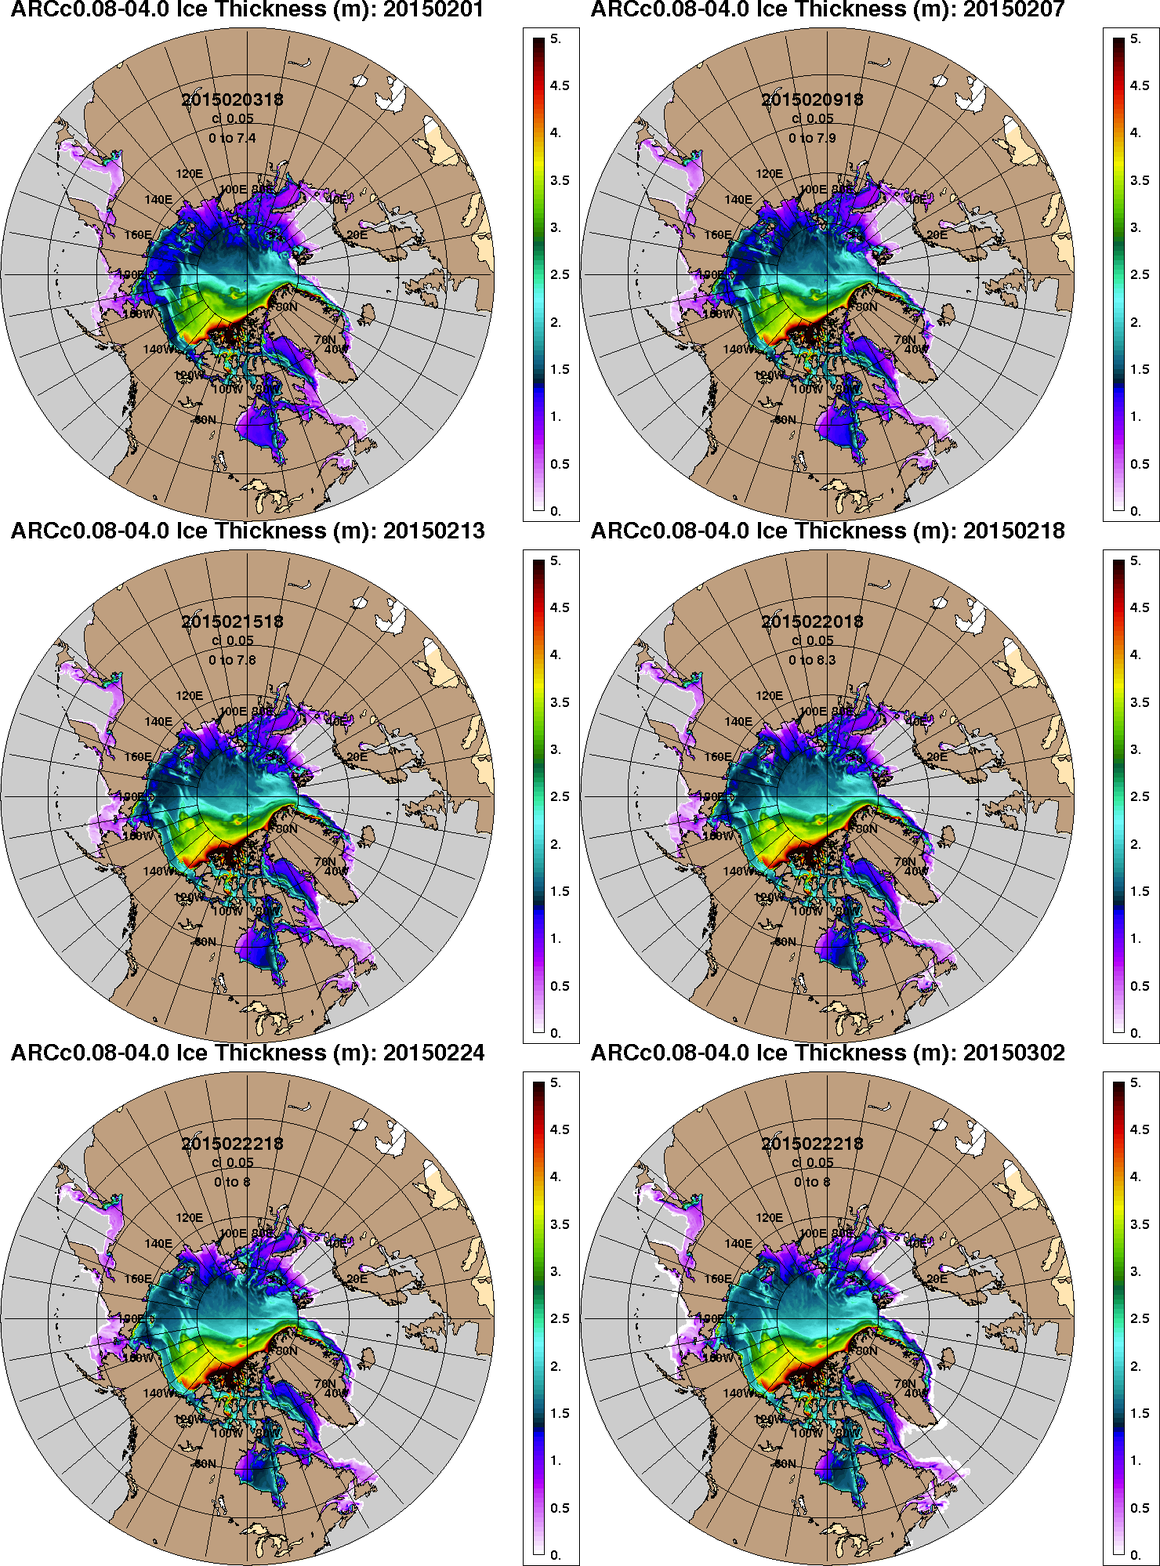
Below is a 30-day animation showing sea ice thickness (in m) up to February 22, 2015 (and forecast up to March 2), from the U.S. Naval Research Laboratory.


As the Arctic's snow and ice cover decline, more sunlight gets absorbed that previously was reflected back into space. All this adds up to a very dangerous situation, since huge amounts of methane are contained in sediments under the seafloor of the Arctic Ocean, and they can get destabilized as the water warms up.

In conclusion, feedbacks make that the Arctic is warming more rapidly than the rest of the globe and they threaten to trigger huge methane eruptions from the seafloor of the Arctic Ocean.

Methane concentrations over the Arctic Ocean are very high at the moment. The image below shows the very high peak methane levels that have recently been recorded, against a background image showing high methane levels over the East Siberian Arctic Shelf on February 20, 2015.


The situation is dire and calls for comprehensive and effective action, as discussed at the Climate Plan blog.


Thursday, February 12, 2015

Something had to give - Baffin Island hit by M4.6 earthquake

An earthquake with a magnitude of 4.6 on the Richter scale hit Baffin Island on February 12, 2015, at 02:11:40 (UTC). The image below, from the United States Geological Survey (USGS), shows the epicenter of the quake.


The earthquake occurred at a time when surface temperature anomalies over parts of North America and Greenland are at the bottom end of the scale, while surface temperature anomalies over parts of Siberia are at the top end of the scale, as illustrated by the image below.


The image below shows pressure differences reaching the top and bottom ends of the scale (left). At the same time, sea surface temperature anomalies around North America and Greenland are at the top end of the scale (right). It appears that something had to give. 


This earthquake is important, given that it hit an area without large faultlines (though earthquakes are common here, also see this discussion). The Baffin Island earthquake occurred in an area prone to glacial isostatic adjustment, as illustrated by the image below.

From "http://grace.jpl.nasa.gov", (unfiltered version). Credit: A, G., J. Wahr, and S. Zhong (2013) "Computations
of the viscoelastic response of a 3-D compressible Earth to surface loading: an application to Glacial Isostatic
Adjustment in Antarctica and Canada", Geophys. J. Int., 192, 557–572, doi: 10.1093/gji/ggs030
Glacial isostatic adjustment as a phenomenon takes place over relatively long periods. An additional problem is extreme weather events influencing the occurence of earthquakes more immediately.

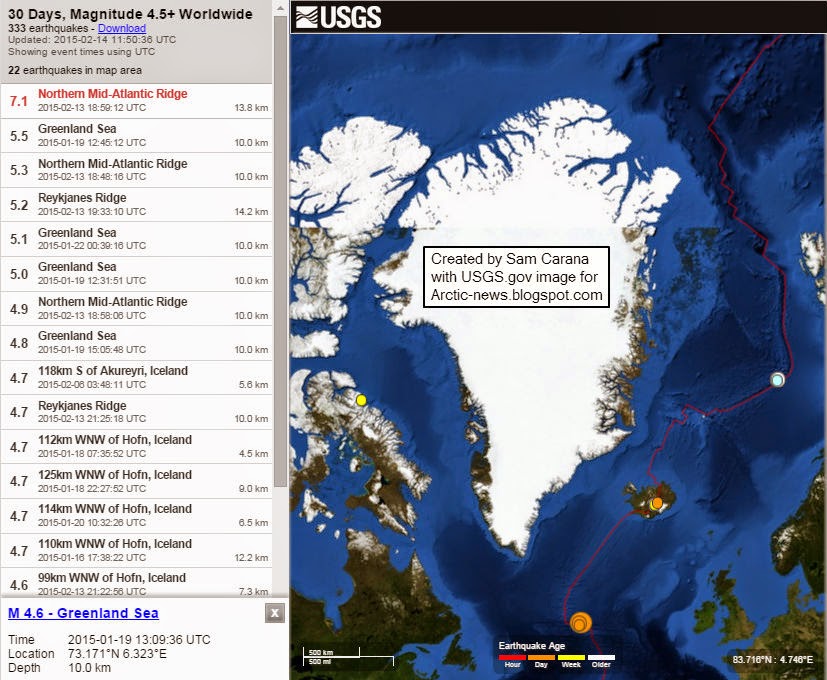
Here's an update on the situation. Five earthquakes occured on February 13, 2015, close together, including a magnitude 7.1 at the Northern Mid-Atlantic Ridge, south of Greenland:
- M5.3 Northern Mid-Atlantic Ridge 2015-02-13 18:48:16 UTC 10.0 km
- M4.9 Northern Mid-Atlantic Ridge 2015-02-13 18:58:06 UTC 10.0 km
- M7.1 Northern Mid-Atlantic Ridge 2015-02-13 18:59:12 UTC 13.8 km
- M4.7 Reykjanes Ridge 2015-02-13 21:25:18 UTC 10.0 km
- M5.2 Reykjanes Ridge 2015-02-13 19:33:10 UTC 14.2 km

This M7.1 is the largest earthquake to hit the area around Greenland in a decade or more. And it's not just this one that has recently hit the area. The image below shows the recent Baffin Island quake in yellow, and the earthquakes that occurred today at the Northern Mid-Atlantic Ridge in orange. Furthermore, there are recent quakes on Iceland in orange and yellow. There were also three large earthquakes in the Greenland Sea, the 4.6 one is highlighted in blue (otherwise it would have been hidden).


The image below gives an impression of extreme weather events on February 13-14, 2015. 


Boston has meanwhile run out of room to dump snow, while roofs have collapsed in Massachusetts under the weight of the snow. Lnks between extreme weather events and earthquakes have been discussed before. Extreme weather events look set to intensify as temperatures in the Arctic keep rising. This is very worrying, given the vulnerability of methane under the seafloor of the Arctic Ocean. Furthermore, there are also indications that methane could be released from Greenland due to sequences of strong compaction and expansion of the snow and ice cover, due to extreme weather events. 

High methane levels have recently been recorded in the atmosphere over the Arctic Ocean, including over Baffin Bay.


Methane is present in sediments under the Arctic Ocean in the form of free gas and hydrates. Earthquakes can send out strong tremors through the sediment and shockwaves through the water, which can trigger further earthquakes, landslides and destabilization of methane hydrates.

As temperatures in the Arctic keep rising, the jet streams and polar vortex are changing their shape, in particular becoming more wavy, which can cause more extreme weather events such as the events described above.

The situation is dire and calls for comprehensive and effective action, as discussed at the Climate Plan blog


Monday, October 6, 2014

Wild Weather Swings


Above combination-image illustrates some of the wild temperature swings that are taking place on the Northern Hemisphere. While the average temperature anomaly on the Northern Hemisphere may not differ much between the two dates (+0.95°C versus +1.07°C), huge temperature swings can occur locally, as is the case in Greenland.

Note that the overall temperature anomaly for the Arctic is +2.16°C and +3.34°C, respectively, but it can be much more locally. What contributes to these high temperatures in the Arctic is that heat from the Arctic Ocean is entering the atmosphere where there still is open water, while large emissions of methane from the seafloor of the Arctic Ocean are exercizing their high immediate local warming potential.

On the Southern Hemisphere, things aren't much different, as illustrated by the combination-image below.


The two images show that, while the average anomaly for the Southern Hemisphere and for the Antarctic may not differ much between the two dates, temperature anomalies locally may go from one end of the scale to the other.

And it's not merely temperatures that seem to have gone wild. Winds have strengthened, which can push sea ice far out into the sea surrounding Antarctica, while the resulting open water quickly freezes over. The result is expanding sea ice that traps heat in the ocean, as discussed in an earlier post. It appears that much of the extra energy trapped by greenhouse gasses becomes manifest as kinetic energy, in the form of stronger winds, storms and ocean currents.

In conclusion, these huge temperature swings combine with pressure swings and storms, and with swings between expansion and contraction of soil and ice, resulting in severe shocks to ecosystems and infrastructure.

The threat is that infrastructure will increasingly come under stress. Infrastructure that was built up over hundreds, if not thousands of years, is not easily replaced with more durable alternatives. Parts of infrastructure such as roads, buildings, railways, storm water and drainage systems, water supply, dams, levees and power poles may collapse without much scope for repair.

Furthermore, soil degradation will increase, as in some areas storms grow stronger and run-off causes more erosion, while other areas may be hit by more severe droughts and dust-storms. In both cases, ecosystems will suffer and can go into shock, bringing food supply and habitat progressively and possibly abruptly under threat.

As more and deeper cracks and fractures appear in sediments and soils, more methane may start entering the atmosphere. Indications that the integrity of the permafrost is breaking up under the stress of such swings were discussed in earlier posts such as this one and this one. The extra methane can constitute a powerful additional feedback loop, causing strong additional warming locally.

The situation is dire and calls for comprehensive and effective action, as discussed at the Climate Plan blog.


References and Related Posts


- Climate Plan
http://arctic-news.blogspot.com/2014/07/climate-plan.html

- Antarctica linked to Arctic
http://arctic-news.blogspot.com/2014/09/antarctica-linked-to-arctic.html

- What's wrong with the weather?
http://arctic-news.blogspot.com/2014/07/whats-wrong-with-the-weather.html

- Is Global Warming breaking up the Integrity of the Permafrost?
http://methane-hydrates.blogspot.com/2013/05/is-global-warming-breaking-up-the-integrity-of-the-permafrost.html

- Earthquakes in the Arctic Ocean
http://arctic-news.blogspot.com/2014/04/earthquakes-in-the-arctic-ocean.html

- Ten Dangers of Global Warming (written March, 2007)
http://samcarana.blogspot.com/2007/03/ten-dangers-of-global-warming.html


Tuesday, September 30, 2014

Warm water extends from Laptev Sea to North Pole

The NOAA NESDIS image below shows sea surface temperature anomalies of well over 1ºC extending to the North Pole.


The image below gives a world view, showing SST anomalies at the top end of the scale in the Laptev Sea.


The top end of the scale on the above image is 5ºC (or 9ºF).


The visualizations above and below uses a much higher scale. Even this higher-end scale doesn't appear to fully capture the dire situation we are in.


Above image shows warm water entering the Arctic Ocean through the Bering Strait and from the North Atlantic. For months to come, the Gulf Stream will keep pushing warm water into the Arctic Ocean (i.e. water that is warmer than the water in the Arctic Ocean). It takes some time (i.e. months) for the warm water from the north Atlantic to arrive in the Arctic Ocean.

Last year, methane emissions started to become huge in October and this lasted for some six months. The image below, from an earlier post, shows methane eruptions from the seafloor of the Arctic Ocean on October 16/17, 2013.


The image below, from another earlier post, shows methane eruptions from the seafloor of the Arctic Ocean on October 31, 2013.


The image below, from yet another earlier post, shows methane levels as high as 2662 parts per billion on November 9, 2013.


This year, there is even more ocean heat present, especially in the north Atlantic and the north Pacific. On September 29, 2014, methane levels as high as 2641 parts per billion were recorded and it looks like worse is yet to come.


The video below, Sea floor methane hydrate climate hazard, is an extract produced by Peter Carter from a presentation by Miriam Kastner, uploaded 7 August 2008 at Youtube.


The situation is dire and calls for comprehensive and effective action, as discussed at the Climate Plan blog.


Thursday, September 18, 2014

Warm water flowing into Arctic Ocean

by Harold Hensel

For the first time in thousands of years, warm water is flowing into the Arctic Ocean. Warm water from the deep ocean is showing up on surface images. There is no way to put this into the context of 'normal.' Historic temperatures have kept the Arctic frozen on an even keel for thousands of years. Even if there was a 'natural cycle' it has been completely overridden by the astonishing amount of pollution that is going into the atmosphere.


Over 90 percent of Earth's energy imbalance has been going into the oceans, almost unnoticed by people keeping track of the temperatures in the atmosphere. The warmer ocean water is going through the Bering Strait and into the Chukchi Sea, Barents Sea, East Siberian Sea and worst of all, the Laptev Sea.

The Gakkel Ridge crosses the Arctic Ocean from Greenland to the Laptev Sea, see earlier post
There are methane hydrate concentrations in all of these areas up to 1,500 feet deep for miles and miles. There are fractures here that give mantel methane a route to the surface that have been safely sealed by ice. The hydrates and seals are thawing.

In 2013, huge amounts of methane erupted over the Gakkel Ridge and
the Laptev Sea
in October, with levels as high as 2662 ppb on November 9.
In 2014, levels over 2400 ppb were recorded on September 14, 15 and 16.

On the Greenland side, warm water is flowing into the Arctic from the Labrador, Greenland and Norway seas. The international SWERUSs-C3 expedition on the icebreaker Oden is recording 'mega flares' of methane. There are many factors involved in warming the Arctic Ocean, but warm water flowing into it is one of the worst.

Harold Hensel
Cedar Rapids