Showing posts with label NASA. Show all posts

Monday, January 19, 2015

Temperature Rise

Record High Temperatures in 2014

The year 2014 was the warmest year across global land and ocean surfaces since records began in 1880, writes NOAA, adding the graph below. This graph illustrates that temperatures have risen even when focusing on a relatively short recent period with a linear trendline starting in 1998, which was an El Niño year, whereas 2014 wasn't.

Source: NOAA Global Analysis - Annual 2014
Most Appropriate Trendline

While the purple 1998-2014 trendline serves the useful purpose of dispelling the myth that warming had halted recently, it isn't the most appropriate trendline, since extending this trendline backward to 1880 would leave too many data too remote from the trendline, as is further illustrated by the animated image below.


What about the blue linear trendline that is based on data for all the years from 1880 to 2014? By that same logic, the appropriateness of this trendline must also be questioned. Temperatures in recent years have been well above this trendline. A polynomial trendline seems a much better fit, as illustrated by the image below.


Above image also extends the trendline forward, showing that 2 degrees Celsius warming looks set to be exceeded in 2038, based on the same data.

And while this is a frightening scenario, the picture may well be much too optimistic, because the heat is felt most in the Arctic Ocean, the very location where some of the most terrifying feedbacks are accelerating local warming, as further explained below.

Feedbacks in the Arctic

As NOAA writes, much of the record warmth for the globe can be attributed to record warmth in the global oceans, which reached the highest temperature among all years in the 1880–2014 record.


As above image shows, ocean heat reached a record high in 2014. In other words, it was ocean heat that pushed the combined ocean and land temperature to a record high. Anomalies were especially high in the Arctic Ocean, as illustrated by the image below.


Waters close to Svalbard reached temperatures as high as 63.5°F (17.5°C) on September 1, 2014 (green circle). Note that the image below shows sea surface temperatures only. At greater depths (say about 300 m), the Gulf Stream is pushing even warmer water through the Greenland Sea than temperatures at the sea surface.


Since the passage west of Svalbard is rather shallow, a lot of this very warm water comes to the surface at that spot, resulting in an anomaly of 11.9°C. The high sea surface temperatures west of Svalbard thus show that the Gulf Stream can carry very warm water (warmer than 17°C) at greater depths and is pushing this underneath the sea ice north of Svalbard.


Planetary energy imbalance (0.6 W/m2) equals the amount of energy in exploding 400,000 Hiroshima atomic bombs per day, 365 days/year (J. Hansen, 16 Jan. 2015).


Planetary imbalance now is 0.6 W/m2. This has made the rise in ocean heat (up to 2000 m deep) more than double over the past decade. Data from 2005 through to 2014 contain a polynomial trendline that points at a similar rise by 2017, followed by an even steeper rise.

What could cause such non-linear rise?

The answer is feedbacks. Arctic snow and ice loss alone may well cause over 2 W/m2 warming, warns Prof. Peter Wadhams. Another such feedback is methane erupting from the ocean floor, as methane hydrates get destabilized due to higher temperatures.

As illustrated by the graph below, most of this excess heat is absorbed by oceans and ice. Some of the heat is consumed by the process of melting ice into water, and 93.4% of this excess heat ends up warming up the oceans.

Graph by Sceptical Science based on study by by Nuccitelli et al.
As the Gulf Stream keeps carrying ever warmer water into the Arctic Ocean, methane gets released in large quantities, as illustrated in the images below showing high methane levels over the East Siberian Arctic Shelf (red oval left) and over Baffin Bay (red oval right) with concentrations as high as 2619 ppb.

click on image to enlarge
The images below show methane levels on Jan 25 (top), and Jan 26, 2015 (bottom).


The threat is that huge amounts of methane will erupt from the seafloor of the Arctic Ocean over the coming decades, as illustrated by the image below.

For more on this image, see this post and this page.
Demise of the Arctic sea ice and snow cover is another terrifying feedback. The image below features a NASA/Goddard Space Flight Center Scientific Visualization Studio screenshot showing decline of multi-year Arctic sea ice area over the years.


Below is a video by Nick Breeze who interviews Professor Peter Wadhams on multi-year Arctic sea ice.


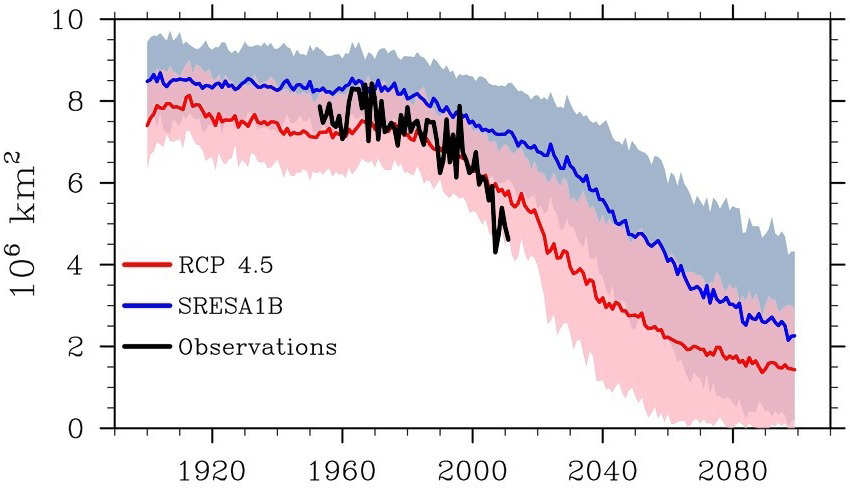
An exponential trendline based on sea ice volume observations shows that sea ice looks set to disappear in 2019, while disappearance in 2015 is within the margins of a 5% confidence interval, reflecting natural variability. In other words, extreme weather events could cause Arctic sea ice to collapse as early as 2015, with the resulting albedo changes further contributing to the acceleration of warming in the Arctic and causing further methane eruptions from the seafloor of the Arctic Ocean.

click on image to enlarge
As the Arctic continues to warm, the temperature difference between the equator and the Arctic declines, resulting in changes to the jet streams and polar vortex.

One such change is a slowing down of the speed at which the jet streams and polar vortex circumnavigate the globe, as discussed in a recent post.

The image on the right shows that the jet streams on the Northern Hemisphere reached speeds as high as 410 km/h (255 miles per hour) on January 9, 2015. Also note the jet stream crossing the Arctic Ocean, rather than staying between 50 and 60 degrees latitude, where the polar jet streams used to be.

The image below shows winds on January 11, 2015, at several altitudes, i.e. at 10 hPa | ~26,500 m (16.5 mile), high in stratosphere, polar vortex (left, at 250 hPa | ~10,500 m (6.5 mile), jet stream (center), and at 700 hPa | ~3,500 m (2.2 mile), high in planetary boundary layer.

click on image to enlarge
As a result, extreme weather events such as heatwaves and storms can be expected to occur with greater frequency and intensity, as also discussed in a recent post. Heatwaves can heat up the water in the North Atlantic, as it flows into the Arctic Ocean, driven by the Gulf Stream, while heatwaves can also warm up the water in rivers that end up in the Arctic Ocean. Heatwaves can also hit the sea ice in the Arctic Ocean directly, causing rapid sea ice melting, while storms can make the ice break up and be driven out of the Arctic ocean,

Demise of the sea ice and snow cover in the Arctic results in further acceleration of warming, not only due to less sunlight getting reflected back into space, but also due to loss of the buffer that currently absorbs huge amounts of heat as it melts in summer. With the demise of this latent heat buffer, more sunlight will instead go into heating up the water of the Arctic Ocean. For more on the latter, see the page on latent heat.


Above image illustrates some of the self-reinforcing feedback loops that have been highlighted in this and earlier posts. Further feedbacks are pictured in the image below.

from the Feedbacks page
Runaway Global Warming

Above feedbacks are already pushing the temperature rise in the Arctic through the 2°C guardrail.


Based on existing temperature data, global warming on land looks set to exceed 2°C (3.6°CF) warming by the year 2034, but methane eruptions from the seafloor of the Arctic Ocean could push up global temperature rise even faster, in a runaway global warming scenario.

click to enlarge image
This raises the specter of human extinction. With no action taken, there appears to be a 55% risk that humans will be extinct by the year 2045, while taking little action will only postpone near-term human extinction by a few years. Only with rapid implementation of comprehensive and effective action may we be able to avoid this fate.


Comprehensive and Effective Action

In conclusion, the situation is dire and calls for comprehensive and effective action, as discussed at the Climate Plan blog at climateplan.blogspot.com and as illustrated by the image below.


Saturday, April 6, 2013

How much will temperatures rise?

If we take the NASA Annual Mean Land-Ocean Temperatures and draw a projection into the future, temperatures will quickly be 3 degrees Celsius higher than the base period (1951-1980), i.e. well before 2050, as illustrated on image 1. below. 

Image 1. Temperatures will be 3 degrees Celsius higher well before 2050

Above projection appears to be steeper than even the worst-case scenario pictured by the IPCC for years, such as on the image below.

Image 2. from IPCC 2001. Projections of globally averaged surface temperature 2000-2100 are shown for six SRES scenarios and IS92a using a model with average climate sensitivity. The grey region marked "several models all SRES envelope" shows the range of results from the full range of 35 SRES scenarios in addition to those from a range of models with different climate sensitivities. The temperature scale is departure from the 1990 value.
Could temperatures rise faster in future than what the IPCC anticipated in 2001? The answer must be yes! In 2007, the IPCC described that, even if greenhouse gas concentrations in the atmosphere were stabilized for 100 years at year 2000 values (B1), then we would still be committed to a further warming of 0.5°Celsius. This committed warming should not be confused with ‘unavoidable climate change’ over the next half century, which would be greater because forcing cannot be instantly stabilized. And of course, as it turned out, emissions have not been stabilized at 2000 values, but have in fact increased substantially.

As it turned out, the models used by the IPCC made all kinds of assumptions that didn't eventuate. But before deciding to instead settle for a relatively simple extrapolation of observed data, there are some issues that require a further look.  

As discussed in the earlier post Accelerated Arctic Warming, temperatures in the Arctic have been rising at a much faster pace than global temperatures, and if this accelerated rise continues, we can expect a 10 degrees Celsius rise in the Arctic before 2040, as illustrated by image 3. below.  

Image 3. Three kinds of warming - 2: Accelerated warming in the Arctic 
Such a temperature rise in the Arctic will undoubtedly lead to additional greenhouse gas emissions in the Arctic, of carbon dioxide, nitrous oxide and particularly methane, threatening to trigger runaway global warming. 

The image below, from the methane-hydrates blog, combines these three kinds of warming, showing global temperatures that soon catch up with accelerated Arctic warming, as heatwaves at high latitudes will cause wildfires, in particular in Siberia, where firestorms in peat-lands, tundras and forests could release huge amounts of emissions, including soot, much of which could settle on the Himalayan plateau, darkening the ice and snow and resulting in more local heat absorption. Rapid melt of glaciers will then cause flooding at first, followed by dramatic decreases in the flow of river water that up to a billion people now depend on for water supply and irrigation.

In other words, the situation looks much more dire than what most models make us believe; the more reason to adopt the climate plan that is also described at the post at the methane-hydrates blog.

Image 4. Three kinds of warming - 1, 2 and 3 


References

- IPCC (TAR) - Climate Change 2001: Synthesis Report

- IPCC (AR4) - Climate Change 2007: Working Group I: The Physical Science Basis

- Accelerated Arctic Warming

- Methane hydrates

Friday, March 22, 2013

Arctic Ice Breaks Up in Beaufort Sea


The NOAA image below gives an update on the temperature anomaly over Greenland, as earlier discussed in the post including Huge patches of warm air over the Arctic.


Below a NOAA animation showing a 30-day loop (up to March 19, 2013) of analyzed 200-hPa heights and anomalies. An eleven-day mean, centered on the date indicated in the title, of 200-hPa heights and anomalies from the NCEP Climate Data Assimilation System (CDAS), is shown for the first 25 days of the animation. 10-, 9-, 8-, 7-, and 6-day running means are shown for the last 5 days, respectively. Contour interval for heights is 120 m, anomalies are indicated by shading. Anomalies are departures from the 1979-95 daily base period means.


As discussed in earlier posts (see below), changes to the jet stream are making extreme weather events increasingly likely to occur, which spells bad news for the sea ice.


Below a NASA video with satellite images showing the Arctic sea ice breaking up in the Beaufort Sea.


A series of intense storms in the Arctic has caused fracturing of the sea ice around the Beaufort Sea along the northern coasts of Alaska and Canada. High-resolution imagery from the Suomi NPP satellite shows the evolution of the cracks forming in the ice, called leads, from February 17 -- March 18 2013. The general circulation of the area is seen moving the ice westward along the Alaskan coast.


Finally, the Naval Research Laboratory animation below shows the thickness of the sea ice over the past 30 days.


Related posts

Huge patches of warm air over the Arctic
Polar jet stream appears hugely deformed
Hurricane Sandy moving inland

Thursday, January 17, 2013

Accelerated Arctic Warming

The more northern we look, the more Earth is warming, as shown by the NASA image below.

global temperature anomalies averaged from 2008 through 2012, NASA Goddard Institute for Space Studies
The interactive image below shows temperature anomalies for the different latitudional zones over time.

The Arctic (red line above) clearly shows the strongest warming over time, while accelerating in recent years. The best fit for this warming in the Arctic is a fourth order polynomial trendline, as added to the data on the image below.


This accelerated warming in the Arctic is threatening to destabilize the methane in the seabed and trigger runaway global warming within a decade. Effective action needs to be taken before it's too late!

Wednesday, September 19, 2012

NSIDC calls record 2012 low

This NASA satellite image shows how the Arctic sea ice extent, on Sept. 16, 2012, compares to the average
minimum extent over the past 30 years (in yellow). Credit: NASA/Goddard Scientific Visualization Studio.
Arctic sea ice cover likely melted to its minimum extent for the year on September 16, says the National Snow and Ice Data Center (NSIDC), adding the note that this number is preliminarychanging weather conditions could still push the ice extent lower.

Sea ice extent—defined by NSIDC as the total area covered by at least 15 percent of ice—fell to 3.41 million square kilometers (1.32 million square miles), now the lowest summer minimum extent in the 33-year satellite record.

NSIDC adds that this minimum is 49% below the 1979 to 2000 average, as illustrated by the table below.

Table 1. Previous minimum Arctic sea ice extents
 YEARMINIMUM ICE EXTENTDATE
IN MILLIONS OF SQUARE KILOMETERSIN MILLIONS OF SQUARE MILES
20074.171.61September 18
20084.591.77September 20
20095.131.98September 13
20104.631.79September 21
20114.331.67September 11
20123.411.32September 16
1979 to 2000 average6.702.59September 13
1979 to 2010 average6.142.37September 15

NSIDC adds that the six lowest seasonal minimum ice extents in the satellite record have all occurred in the last six years (2007 to 2012). In contrast to 2007, when climatic conditions (winds, clouds, air temperatures) favored summer ice loss, this year’s conditions were not as extreme. Summer temperatures across the Arctic were warmer than average, but cooler than in 2007. The most notable event was a very strong storm centered over the central Arctic Ocean in early August. It is likely that the primary reason for the large loss of ice this summer is that the ice cover has continued to thin and become more dominated by seasonal ice. This thinner ice was more prone to be broken up and melted by weather events, such as the strong low pressure system just mentioned. The storm sped up the loss of the thin ice that appears to have been already on the verge of melting completely.

NASA says that this year, a powerful cyclone formed off the coast of Alaska and moved on August 5 to the center of the Arctic Ocean, where it churned the weakened ice cover for several days. The storm cut off a large section of sea ice north of the Chukchi Sea and pushed it south to warmer waters that made it melt entirely. It also broke vast extensions of ice into smaller pieces more likely to melt.

“The storm definitely seems to have played a role in this year's unusually large retreat of the ice”, said Claire Parkinson, a climate scientist at NASA Goddard Space Flight Center, Greenbelt, Md. “But that exact same storm, had it occurred decades ago when the ice was thicker and more extensive, likely wouldn't have had as prominent an impact, because the ice wasn't as vulnerable then as it is now.”

In the press release, NSIDC lead scientist Ted Scambos said that thinning ice, along with early loss of snow, are rapidly warming the Arctic. “But a wider impact may come from the increased heat and moisture the warmer Arctic is adding to the climate system,” he said. “This will gradually affect climate in the areas where we live,” he added. “We have a less polar pole—and so there will be more variations and extremes.”

The image below, from Arctic Sea Ice Blog, shows Arctic sea ice observations (in red) against the backdrop of models used in IPCC AR4 (2007) for projection of sea ice up to the year 2100.


The image below, from NSIDC sea ice news, shows the observed September sea ice extent for 1952-2011 (black line) against a backdrop of projections used by IPCC AR4 (blue) as well as proposed for use in IPCC AR5 (red).

Note: The record low value for 2012 still has to be added on this image. Credit: NSIDC, Stroeve et al.
The image shows that the recently observed decline in sea ice extent is steeper than the CMIP3 models with a “business as usual” SRESA1B greenhouse gas emissions scenario (blue line), as used by the IPCC in AR4.

It is also steeper than the more recent CMIP5 models using a RCP 4.5 scenario (pink line) that are proposed to be used by the IPCC in AR5.

RCP 4.5 is a scenario in which the global temperature rise would would soon exceed 2 degrees Celsius. Since the Arctic experiences accelerated warming, such a scenario would clearly be catastrophic. Looking at sea ice volume, rather than extent, would show this even more clearly.

Below, a NOAA animation showing sea ice decline in 2012 and a NASA animation showing the Arctic cyclone.


Above animation shows the 2012 time-series of ice extent using sea ice concentration data from the DMSP SSMI/S satellite sensor. The black area represents the daily average (median) sea ice extent over the 1979-2000 time period. Layered over top of that are the daily satellite measurements from January 1 to September 14, 2012. Published September 17, 2012 by NOAA Visualizations.

Below the NASA animation
Arctic Cyclone Breaks Up Sea Ice

As said in the NSIDC news release, Northern Hemisphere sea ice extent dropped to 3.41 million square kilometers (1.32 million square miles) on September 16, 2012. Between March 20, 2012, and September 16, 2012, 11.83 million square kilometers (4.57 million square miles) of ice was lost.

By comparison, this is more than the land and inland waters covered by the United States (or Canada, or China, for that matter). It is also more than the 9,826,630 square km (3,794,080 sq mi) covered by the United States when all its land, inland waters, the Great Lakes, coastal waters and territorial waters are included.

United States


Thursday, September 6, 2012

Noctilucent clouds indicate more methane in upper atmosphere

Noctilucent clouds [credit: NASA]
The inner solar system is littered with meteoroids of all shapes and sizesfrom asteroid-sized chunks of rock to microscopic specks of dust. Every day Earth scoops up tons of the material, mostly the small stuff. When meteoroids hit our atmosphere and burn up, they leave behind a haze of tiny particles suspended 70 km to 100 km above Earth's surface.

Inside the meteor smoke zone, at a height of 83 km, so-called noctilucent clouds can occur, describes a NASA article. Meteor dust is the nucleating agent around which such clouds form. Specks of meteor smoke act as gathering points where water molecules can assemble themselves and grow into ice crystals to sizes ranging from 20 to 70 nanometers.

While noctilucent clouds appear most often at Arctic latitudes, they have been sighted in recent years as far south as Colorado, Utah and Nebraska. Question is: Why are the clouds brightening and spreading?

Prof. James Russell of Hampton University believes that more in methane in the atmosphere is causing this. Russell explains: "When methane makes its way into the upper atmosphere, it is oxidized by a complex series of reactions to form water vapor. This extra water vapor is then available to grow ice crystals for noctilucent clouds."

In conclusion, this greater occurrence of octilucent clouds is an indication that more methane is escaping into the upper atmosphere.

Graphic prepared by Prof. James Russell of Hampton University showing how methane, a    
greenhouse gas, boosts the abundance of water at the top of Earth's atmosphere. This water
then freezes around "meteor smoke" to form icy noctilucent clouds.              [Credit:  NASA] 

Below, a new ScienceCast video explains how "meteor smoke" seeds noctilucent clouds.


Tuesday, July 24, 2012

Greenland is melting at incredible rate

The combination-image below shows how much the ice on Greenland melted between July 8 (left) and July 12 (right).

On July 8, about 40% of the ice sheet had undergone thawing at or near the surface. In just a few days, the melting had dramatically accelerated and some 97% of the ice sheet surface had thawed by July 12. 

In the image, the areas classified as “probable melt” (light pink) correspond to those sites where at least one satellite detected surface melting. The areas classified as “melt” (dark pink) correspond to sites where two or three satellites detected surface melting. The satellites are measuring different physical properties at different scales and are passing over Greenland at different times. Credit: Nicolo E. DiGirolamo, SSAI/NASA GSFC, and Jesse Allen, NASA Earth Observatory.
For several days this month, Greenland's surface ice cover melted over a larger area than at any time in more than 30 years of satellite observations. Nearly the entire ice cover of Greenland, from its thin, low-lying coastal edges to its two-mile-thick center, experienced some degree of melting at its surface, according to measurements from three independent satellites analyzed by NASA and university scientists.

On average in the summer, about half of the surface of Greenland's ice sheet naturally melts. At high elevations, most of that melt water quickly refreezes in place. Near the coast, some of the melt water is retained by the ice sheet and the rest is lost to the ocean. But this year the extent of ice melting at or near the surface jumped dramatically. According to satellite data, an estimated 97% of the ice sheet surface thawed at some point in mid-July.

This extreme melt event coincided with an unusually strong ridge of warm air, or a heat dome, over Greenland. The ridge was one of a series that has dominated Greenland's weather since the end of May. "Each successive ridge has been stronger than the previous one," said Mote. This latest heat dome started to move over Greenland on July 8, and then parked itself over the ice sheet about three days later. By July 16, it had begun to dissipate.

As the ice warms, it loses albedo, i.e. less sunlight is reflected back into space. Darker surface absorbs more sunlight, accelerating the melting. The image below shows the Greenland ice sheet albedo from 2000 to 2011.

Credit: NOAA Arctic Report Card 2011.

The image below, from the meltfactor blog and by Jason Box and David Decker, shows the steep fall in reflectivity for altitudes up to 3200 meters in July 2012. 


The image below, from the meltfactor blog, shows how the year 2012 compares with the situation at approximately the same time in previous years, 2011 and 2010, which are recognized as being record melt years. 


The photo below shows how dark the ice sheet surface can become.

Photo shot by Jason Box on August 12, 2005
Loss of albedo occurs as the darker bare ground becomes visible where the ice has melted away. Darkening of snow and ice can start even before melting takes place. Warming changes the shape and size of the ice crystals in the snowpack, as described at this NASA Earth Observatory page. As temperatures rise, snow grains clump together and reflect less light than the many-faceted, smaller crystals. Additional heat rounds the sharp edges of the crystals, and round particles absorb more sunlight than jagged ones. 

Dirty ice surrounds a meltwater stream near the margin of the ice sheet. Compared to fresh snow and clean ice, the dark surface absorbs more sunlight, accelerating melting. © Henrik Egede Lassen/Alpha Film, from the Snow, Water, Ice, and Permafrost in the Arctic report from the U.N. Arctic Monitoring and Assessment Programme. From NOAA Climatewatch.
Another factor contributing to darkening is aerosols, in particular soot (i.e. black carbon) from fires and combustion of fuel, dust and organic compounds that enter the atmosphere and that can travel over long distances and settle on ice and snow in the Arctic. 

The July data since 2000, from the meltfactor blog, suggest a exponential fall in reflectivity that, when projected into the future (red line, added by Sam Carana), looks set to go into freefall next year. 

Is a similar thing happening all over the Arctic? Well, the map below, edited from a recent SSMIS Sea Ice Map, shows that sea ice concentration is highest around the North Pole. 


So, can water be expected to show up at the North Pole? Well have a look at the photo from the North Pole webcam below. 


Photo from the North Pole webcam
It does look like melting is going on at the North Pole. Water is significantly darker than ice, meaning the overall reflectivity will be substantially lowered by this water. 

It's important to realize that surface albedo change is just one out of a number of feedbacks, each of which deserves a closer look. 

As shown on the image below, the IPCC describes four types of feedbacks with a joint Radiative Forcing of about 2 W/sq m, i.e. water vapor, cloud, surface albedo and lapse rate. 


The image below, from James Hansen et al., may at first glance give the impression that all aerosols have a cooling effect. 


When components are split out further, it becomes clear though that some aerosols are reflective and have a cooling effect, whereas black carbon has a warming effect, while changes in snow albedo also contribute to warming. On the interactive graph below, you can click on or hover over each component to view their radiative forcing. When isolated from other factors, it's clear that snow albedo has an increasing warming effect.
How much could Earth warm up due to decline of snow and ice? Professor Peter Wadhams estimates that the drop in albedo in case of total loss of Arctic sea ice would be a 1.3 W/sq m rise in radiative forcing globally, while additional decline of ice and snow on land could push the the combined impact well over 2 W/sq m.

Locally, the impact could be even more dramatic. The image below, from Flanner et al., shows how much the snow and ice is cooling the Arctic. 


Image, edited by Sam Carana, from Mark Flanner et al. (2011).
Conversely, above image shows how much the Arctic could warm up without the snow and ice. Due to albedo change, sunlight that was previously reflected back into space will instead warm up the Arctic. What could have a big impact locally is that, where there's no more sea ice left, all the heat that previously went into melting will raise temperatures instead, as described at Warming in the Arctic.

The big danger is methane. Drew Shindell et al. show in Improved Attribution of Climate Forcing to Emissions that inclusion of aerosol responses will give methane a much higher global warming potential (GWP) than the IPCC gave methane in AR4, adding that methane's GWP would likely be further increased by including ecosystem responses. Indeed, as pictured in the image below, accelerated warming in the Arctic could trigger methane releases which could cause further methane releases, escalating into runaway global warming