Showing posts with label heat. Show all posts

Friday, March 27, 2015

Methane Levels Early 2015


The image below shows highest mean methane readings on one day, i.e. March 10, compared between three years, i.e. 2013, 2014 and 2015, at selected altitudes. The comparison indicates that the increase of methane in the atmosphere is accelerating, especially at higher altitudes.


The table below shows the altitude equivalents in mb (millibar) and feet.

56925 feet44689 feet36850 feet30569 feet25543 feet19819 feet14383 feet8367 feet1916 feet
74 mb147 mb218 mb293 mb367 mb469 mb586 mb742 mb945 mb

This rise in global mean methane levels appears to go hand in hand with much higher peak readings, especially at higher altitudes.


From January 1 to March 20, 2015, methane levels reached levels as high as 2619 ppb (on January 12, 2015), while peak daily levels averaged 2373 parts per billion (ppb). At the start of the year, global mean methane levels typically reach their lowest point, while highest mean levels are typically reached in September. Highest daily global mean methane levels for the period from January 1, 2015, to March 20, 2015, ranged from 1807 ppb (January 6, 2015) to 1827 ppb (March 5, 2015).

Further study of the locations with high methane levels indicates that much of the additional methane appears to originate from releases at higher latitudes of the Northern Hemisphere, in particular from the Arctic Ocean, from where it is over time descending toward the equator (methane will typically move closer to the equator over time as it rises in altitude, as discussed in this earlier post).

The largest source of additional methane appears to be emissions from the seabed of the Arctic Ocean. Annual emissions from hydrates were estimated to amount to 99 Tg annually in a 2014  post (image below).


The image below, based on data from the IPCC and the World Metereological Organization (WMO), with an added observation from a NOAA MetOp satellite image, illustrates the recent rise of methane levels and the threat that methane levels will continue to rise rapidly.


What causes these methane eruptions?

Methane eruptions from the seafloor of the Arctic Ocean appear to be primarily caused by rising ocean heat that is carried by the Gulf Stream into the Arctic Ocean. The image below shows sea surface temperatures of 20.9°C (69.62°F, green circle left) recorded off the coast of North America on March 14, 2015, an anomaly of 12.3°C (36.54°F).

[ click on image to enlarge ]
Furthermore, both methane eruptions from the Arctic Ocean seafloor and demise of the Arctic sea ice and snow cover are feedbacks that can interact and amplify each other in non-linear ways, resulting in rapid and intense temperature rises, as illustrated by the image below.

Diagram of Doom - for more background, see Feedbacks
How high could temperatures rise?

Worryingly, a non-linear trend is also contained in the temperature data that NASA has gathered over the years, as described in an earlier post. A polynomial trendline points at global temperature anomalies of over 4°C by 2060. Even worse, a polynomial trend for the Arctic shows temperature anomalies of over 4°C by 2020, 6°C by 2030 and 15°C by 2050, threatening to cause major feedbacks to kick in, including albedo changes and methane releases that will trigger runaway global warming that looks set to eventually catch up with accelerated warming in the Arctic and result in global temperature anomalies of 16°C by 2052.

[ click on image to enlarge ]
Action

The situation is dire and calls for comprehensive and effective action, as discussed at the Climate Plan blog.


Comparison between three years, i.e. 2013, 2014 and 2015, of highest mean methane readings at selected altitudes on...
Posted by Sam Carana on Friday, March 27, 2015

Saturday, February 28, 2015

The Mechanism

What is the mechanism behind accelerated warming of the Arctic Ocean, huge abrupt methane eruptions from the seafloor of the Arctic Ocean and skyrocketing temperatures?


1. Potential for Methane Release in Arctic

Vast amounts of methane are stored in hydrates under the seafloor of the Arctic Ocean. Furthermore, vast amounts of methane in the form of free gas are contained in sediments under the seafloor of the Arctic Ocean. Thirdly, vast amounts of carbon are frozen in the permafrost and much may enter the atmosphere in the form of methane as the permafrost copntinues to melt.

Natalia Shakhova et al. in 2010 estimated the accumulated potential for the East Siberian Arctic Shelf (ESAS) region alone (image on the right) as follows:
- organic carbon in permafrost of about 500 Gt
- about 1000 Gt in hydrate deposits
- about 700 Gt in free gas beneath the gas hydrate stability zone.

In early 2014, Sam Carana estimated annual methane emissions from hydrates and permafrost at 100 Tg (i.e. 0.1 Gt). This methane will contribute to further warming of the air over the Arctic and the North Atlantic, causing further further extreme weather events, such as heatwaves and storms along the path of the Gulf Stream from the North Atlantic into the Arctic Ocean, in turn triggering further releases from hydrates at the seafloor of the Arctic Ocean and escalating into runaway global warming.


Such methane eruptions are caused by warming water of the Arctic Ocean, which in turn is due to emissions by people. Some elements of the mechanism causing methane to erupt from the seafloor are described in more detail below.

2. Ocean Heat
From: Ocean Temperature Rise continues
Above graph, based on NOAA data, shows a polyomial trendline pointing at a Northern Hemisphere sea surface temperature rise of more than 5°C (9°F) by 2050, compared to the 20th century average, from an earlier post.

Waters at greater depth are also warming rapidly, as illustrated by the image on the right, from an earlier post, showing a rise in ocean heat up to 2000 m deep that has more than doubled over the past decade. Data from 2005 through to 2014 conatain a polynomial trendline that points at a similar rise by 2017, followed by an even steeper rise.

The North Atlantic is warming rapidly, with sea surface temperature anomalies as high as a 12°C (21.6°F) recorded east of North America earlier this year, as illustrated by the image below.

A warmer North Atlantic is a major contributor to the rapidly warming waters of the Arctic Ocean, since the Gulf Stream keeps carrying warmer water into the Arctic Ocean all year long.

A further contributor is a warmer North Pacific.

Further contributions come from the combined impact of numerous feedbacks, in particular changing winds and currents, cryosphere changes and methane releases, as further described below.

From: Watch where the wind blows

3. Feedbacks: Changing Winds and Currents, Cryosphere Changes and Methane

- Changed Winds and Currents

Emissions by people are not only causing temperatures of the atmosphere and oceans to rise, they are also causing winds and ocean currents to change. Such changes can in turn result in heatwaves that are more intense and that persist for prolonged periods. Furthermore, strong northbound winds, combined with strong precipitation and waves can speed up the volume of warm water carried by Gulf Stream into the Arctic Ocean, as discussed in an earlier post

- Arctic Sea Ice

A warming atmosphere, warming oceans and decline of the Arctic snow and ice cover all go hand in hand. The IPCC concluded in AR5 that, for RCP8.5, the Arctic Ocean will likely be nearly ice-free in September before mid-century. Prof. Peter Wadhams warned, back in 2012, that the Arctic Ocean could be virtually ice-free within a few years. An exponential trendline based on sea ice volume observations shows that sea ice looks set to disappear in 2019, while disappearance in 2015 is within the margins of a 5% confidence interval, reflecting natural variability, as discussed at the FAQ page.


- Permafrost

Permafrost decline will cause Arctic temperatures to rise, due to albedo change and due to carbon that is contained in the permafrost and that can be expected to be released in the form of methane or carbon dioxide as the permafrost melts. The image below pictures permafrost decline as foreseen by the IPCC in AR5. 


Obviously, rapid decline of the sea ice will come with albedo changes that will also make the permafrost decline more strongly than the IPCC foresees, while they will also cause even more extreme weather events. One of the dangers is that huge amounts of warmer water will flow from rivers into the Arctic Ocean, as discussed below.

- Warmer Water From Rivers

More sunlights getting absorbed in the Arctic will accelerate warming of the Arctic Ocean directly, while there will also be warmer water flowing into the Arctic Ocean from rivers in Siberia and North America, fueled by stronger and longer heatwaves, storms and wildfires. 

map from: http://en.wikipedia.org/wiki/File:Rs-map.png
Above map shows that a number of large rivers in Siberia end up in the Arctic Ocean. Another large river is the Mackenzie River, which ends in the Beaufort Sea, north of Alaska, where sea surface temperatures of about 20°C (68°F) were recorded in 2013, as the image below illustrates.


Another area of concern, also marked with a purple oval in the image below, is located in the north of Canada.


More extreme weather events include heat waves, storms, floods and wildfires, all of which can contribute to more rapid warming of the Arctic Ocean.

The combined effect of all the above will be that methane that is now contained in the form of free gas and hydrates in sediments under the Arctic Ocean, can be expected to be increasingly released as the Arctic Ocean warms further.

- Methane 

Of the vast amounts of methane stored in the Arctic, much of it is prone to be released with further temperature rises, as discussed in this earlier post and in this earlier post. Cracks in sediments used to be filled with ice. Warmer water is now melting the ice that used to sit in cracks. This ice has until now acted as a glue, holding the sediment together. Moreover, the ice in the cracks has until now acted as a barrier, a seal, that prevented the methane contained in those sediments from escaping. In a video interview with Nick Breeze, Natalia Shakhova mentions a sample of sediment taken from the ESAS seafloor in 2011 that turned out to be ice-free to a depth of 53 m at water temperatures varying from -0.6˚C to -1.3˚C. Back in 2008, Natalia Shakhova et al. considered release of up to 50 Gt of predicted amount of hydrate storage as highly possible for abrupt release at any time.

The image below, based on data from the IPCC and the World Metereological Organization (WMO), with an added observation from a NOAA MetOp satellite image, illustrates the recent rise of methane levels and the threat that methane levels will continue to rise rapidly.


When looked at from a longer range of years, above image fits in the black square on the image below.


The image below shows exponential rise based on data of East Siberian Arctic Shelf (ESAS) releases alone, as discussed in an earlier post.


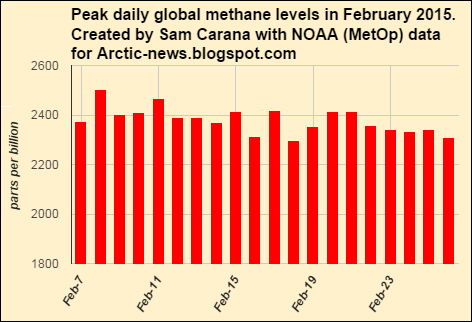
Non-linear rise is supported by the fact that methane's lifetime increases as more methane enters the atmosphere. As the image below shows, peak methane levels have been very high recently.


All these feedbacks can interact and amplify each other in non-linear ways, resulting in rapid and intense temperature rises, as illustrated by the image below.

Diagram of Doom - for more background, see Feedbacks

4. Runaway Global Warming

The threat is that such rapid temperature rises will appear at first in hotspots over the Arctic and eventually around the globe, while also resulting in huge temperature swings that could result in depletion of supply of food and fresh water, as further illustrated by the above image, from an earlier post, and the image below, from another earlier post.

Rapidly rising temperatures will cause stronger evaporation of sea water. Since water vapor is one of the strongest greenhouse gases, this can further contribute to the non-linear temperature rises pictured above.

In conclusion, the situation is dire and calls for comprehensive and effective action, as discussed at the Climate Plan blog.


Sunday, February 22, 2015

Multiple Benefits Of Ocean Tunnels

By Sam Carana and Patrick McNulty

Comprehensive climate action will do more than just cutting emissions, it will also take further action, as pictured in the image below.

Comprehensive and effective action is discussed at the Climate Plan blog
Taking a broad perspective makes it easier for proposed projects to be assessed on their benefits in a multitude of areas.

Ocean tunnels can capture vast amounts of energy from ocean currents, such as the Gulf Stream and the Kuroshio Current. These locations are close to areas with high energy demand, such as the North American East Coast and the coast of East Asia, which can reduce the need for long distance transmission lines.

Ocean tunnels provide clean energy continuously, i.e. 24 hours a day, all year long. This makes that they can satisfy demand for electricity both at peak and off-peak usage times.

  • Their ability to supply large amounts of electricity at times of peak demand will benefit the necessary transition from polluting to clean ways of generating electricity.
  • Their ability to also supply large amounts of electricity at off-peak usage times will help to reduce the price of electricity at such times, thus opening up opportunities for a number of activities that can take place at off-peak hours and that require large amounts of energy.

    Such activities include large-scale grinding of olivine rock and transport of the resulting olivine sand, and large-scale production of hydrogen through electrolysis to power transport (box right). Electrolysis can also create oxygen-enriched water that can improve the quality of waters that are oxygen-depleted.  
Hydrogen to power Shipping

Ocean tunnels can make electricity cheap at off-peak times. This will reduce the cost of recharging batteries of electric vehicles at night.

It will also reduce the cost of producing hydrogen at off-peak hours. To power ships crossing the oceans, hydrogen looks more cost-effective, as such ships cannot return to base for a nighly battery recharge. Such ships have plenty of cargo space to carry hydrogen, even when the hydrogen is not highly compressed. Some of the world's largest ports are close to strong ocean currents.


Ocean tunnels can generate electricity in two ways, i.e. by capturing the kinetic energy contained in the flow of ocean currents, and by means of Ocean Thermal Energy Conversion (OTEC) using temperature differences between cooler deeper parts of the ocean and warmer surface waters to run a heat engine to produce energy. 

Besides generating energy, ocean tunnels can assist with further activities, which will increase the value of ocean tunnels in the fight against climate change. Such activities include the following:
  • By reaching deeper parts of the ocean, OTEC can pull up sunken nutrients and put them out at surface level to fertilize the waters there, while the colder water that is the output of OTEC will float down, taking along newly-grown plankton to the ocean depths before it can revert to CO2, as described in the earlier post Using the Oceans to Remove CO2 from the Atmosphere.
  • Ocean tunnels can be used to distribute olivine sand in the water. The force of the currents and the turbines will help the process of transforming olivine into bicarbonate. This can reduce carbon dioxide levels in the water by sequestering carbon, while also reducing ocean acidification. Olivine sand contains silicate and small amounts of iron, allowing diatoms to grow that will capture additional carbon dioxide, while also raising levels of free oxygen in the water. The latter will stimulate growth of microbes that break down methane in the water before it reaches the atmosphere. Further nutrients can be added, as also discussed in this earlier post
  • Ocean tunnels can also assist with albedo changes. Ocean tunnels can act as the infrastructure to create water microbubbles along their track. Increasing water albedo in this way can reduce solar energy absorption by as much as 100 W m − 2, potentially reducing equilibrium temperatures of standing water bodies by several Kelvins, as Russel Seitz wrote back in 2010. There may also be potential for ocean tunnels to be used to spray water vapor into the air with the aim of brightening clouds over areas where it counts most.
  • The turbines in tunnels will also reduce the flow of ocean currents somewhat, thus reducing the flow of warm water into the Arctic. Furthermore, tunnels can be shaped in ways to guide the flow of warm water away from the Arctic Ocean down a southwards course along the Canary Current along the coast of West Africa. thus diverting warm water that would otherwise end up in the Arctic Ocean. This could also reduce the chance of hurricanes hitting the east coast of North America, as Sandy did in 2012.  
The Gulf Stream, carrying warm water all the way into the Arctic Ocean


Monday, January 19, 2015

Temperature Rise

Record High Temperatures in 2014

The year 2014 was the warmest year across global land and ocean surfaces since records began in 1880, writes NOAA, adding the graph below. This graph illustrates that temperatures have risen even when focusing on a relatively short recent period with a linear trendline starting in 1998, which was an El Niño year, whereas 2014 wasn't.

Source: NOAA Global Analysis - Annual 2014
Most Appropriate Trendline

While the purple 1998-2014 trendline serves the useful purpose of dispelling the myth that warming had halted recently, it isn't the most appropriate trendline, since extending this trendline backward to 1880 would leave too many data too remote from the trendline, as is further illustrated by the animated image below.


What about the blue linear trendline that is based on data for all the years from 1880 to 2014? By that same logic, the appropriateness of this trendline must also be questioned. Temperatures in recent years have been well above this trendline. A polynomial trendline seems a much better fit, as illustrated by the image below.


Above image also extends the trendline forward, showing that 2 degrees Celsius warming looks set to be exceeded in 2038, based on the same data.

And while this is a frightening scenario, the picture may well be much too optimistic, because the heat is felt most in the Arctic Ocean, the very location where some of the most terrifying feedbacks are accelerating local warming, as further explained below.

Feedbacks in the Arctic

As NOAA writes, much of the record warmth for the globe can be attributed to record warmth in the global oceans, which reached the highest temperature among all years in the 1880–2014 record.


As above image shows, ocean heat reached a record high in 2014. In other words, it was ocean heat that pushed the combined ocean and land temperature to a record high. Anomalies were especially high in the Arctic Ocean, as illustrated by the image below.


Waters close to Svalbard reached temperatures as high as 63.5°F (17.5°C) on September 1, 2014 (green circle). Note that the image below shows sea surface temperatures only. At greater depths (say about 300 m), the Gulf Stream is pushing even warmer water through the Greenland Sea than temperatures at the sea surface.


Since the passage west of Svalbard is rather shallow, a lot of this very warm water comes to the surface at that spot, resulting in an anomaly of 11.9°C. The high sea surface temperatures west of Svalbard thus show that the Gulf Stream can carry very warm water (warmer than 17°C) at greater depths and is pushing this underneath the sea ice north of Svalbard.


Planetary energy imbalance (0.6 W/m2) equals the amount of energy in exploding 400,000 Hiroshima atomic bombs per day, 365 days/year (J. Hansen, 16 Jan. 2015).


Planetary imbalance now is 0.6 W/m2. This has made the rise in ocean heat (up to 2000 m deep) more than double over the past decade. Data from 2005 through to 2014 contain a polynomial trendline that points at a similar rise by 2017, followed by an even steeper rise.

What could cause such non-linear rise?

The answer is feedbacks. Arctic snow and ice loss alone may well cause over 2 W/m2 warming, warns Prof. Peter Wadhams. Another such feedback is methane erupting from the ocean floor, as methane hydrates get destabilized due to higher temperatures.

As illustrated by the graph below, most of this excess heat is absorbed by oceans and ice. Some of the heat is consumed by the process of melting ice into water, and 93.4% of this excess heat ends up warming up the oceans.

Graph by Sceptical Science based on study by by Nuccitelli et al.
As the Gulf Stream keeps carrying ever warmer water into the Arctic Ocean, methane gets released in large quantities, as illustrated in the images below showing high methane levels over the East Siberian Arctic Shelf (red oval left) and over Baffin Bay (red oval right) with concentrations as high as 2619 ppb.

click on image to enlarge
The images below show methane levels on Jan 25 (top), and Jan 26, 2015 (bottom).


The threat is that huge amounts of methane will erupt from the seafloor of the Arctic Ocean over the coming decades, as illustrated by the image below.

For more on this image, see this post and this page.
Demise of the Arctic sea ice and snow cover is another terrifying feedback. The image below features a NASA/Goddard Space Flight Center Scientific Visualization Studio screenshot showing decline of multi-year Arctic sea ice area over the years.


Below is a video by Nick Breeze who interviews Professor Peter Wadhams on multi-year Arctic sea ice.


An exponential trendline based on sea ice volume observations shows that sea ice looks set to disappear in 2019, while disappearance in 2015 is within the margins of a 5% confidence interval, reflecting natural variability. In other words, extreme weather events could cause Arctic sea ice to collapse as early as 2015, with the resulting albedo changes further contributing to the acceleration of warming in the Arctic and causing further methane eruptions from the seafloor of the Arctic Ocean.

click on image to enlarge
As the Arctic continues to warm, the temperature difference between the equator and the Arctic declines, resulting in changes to the jet streams and polar vortex.

One such change is a slowing down of the speed at which the jet streams and polar vortex circumnavigate the globe, as discussed in a recent post.

The image on the right shows that the jet streams on the Northern Hemisphere reached speeds as high as 410 km/h (255 miles per hour) on January 9, 2015. Also note the jet stream crossing the Arctic Ocean, rather than staying between 50 and 60 degrees latitude, where the polar jet streams used to be.

The image below shows winds on January 11, 2015, at several altitudes, i.e. at 10 hPa | ~26,500 m (16.5 mile), high in stratosphere, polar vortex (left, at 250 hPa | ~10,500 m (6.5 mile), jet stream (center), and at 700 hPa | ~3,500 m (2.2 mile), high in planetary boundary layer.

click on image to enlarge
As a result, extreme weather events such as heatwaves and storms can be expected to occur with greater frequency and intensity, as also discussed in a recent post. Heatwaves can heat up the water in the North Atlantic, as it flows into the Arctic Ocean, driven by the Gulf Stream, while heatwaves can also warm up the water in rivers that end up in the Arctic Ocean. Heatwaves can also hit the sea ice in the Arctic Ocean directly, causing rapid sea ice melting, while storms can make the ice break up and be driven out of the Arctic ocean,

Demise of the sea ice and snow cover in the Arctic results in further acceleration of warming, not only due to less sunlight getting reflected back into space, but also due to loss of the buffer that currently absorbs huge amounts of heat as it melts in summer. With the demise of this latent heat buffer, more sunlight will instead go into heating up the water of the Arctic Ocean. For more on the latter, see the page on latent heat.


Above image illustrates some of the self-reinforcing feedback loops that have been highlighted in this and earlier posts. Further feedbacks are pictured in the image below.

from the Feedbacks page
Runaway Global Warming

Above feedbacks are already pushing the temperature rise in the Arctic through the 2°C guardrail.


Based on existing temperature data, global warming on land looks set to exceed 2°C (3.6°CF) warming by the year 2034, but methane eruptions from the seafloor of the Arctic Ocean could push up global temperature rise even faster, in a runaway global warming scenario.

click to enlarge image
This raises the specter of human extinction. With no action taken, there appears to be a 55% risk that humans will be extinct by the year 2045, while taking little action will only postpone near-term human extinction by a few years. Only with rapid implementation of comprehensive and effective action may we be able to avoid this fate.


Comprehensive and Effective Action

In conclusion, the situation is dire and calls for comprehensive and effective action, as discussed at the Climate Plan blog at climateplan.blogspot.com and as illustrated by the image below.


Friday, December 26, 2014

Year 2014 Pictures Dire Situation

The year 2014 is shaping up to be the warmest year on record and the heat is felt most strongly in the polar regions and in the oceans. 

Surface Temperatures


Above images show that the Arctic is experiencing accelerating warming. This is causing jet stream changes, resulting in more extreme weather events. Besides creating havoc around the globe, such extreme weather events can further speed up warming of the Arctic Ocean and subsequent release of methane from its seafloor, as described in more detail in a recent post

Ocean Heat

The primary driver of methane release from the Arctic Ocean seafloor is ocean heat. NOAA analysis shows that the global ocean surface temperature for the year-to-date (January through to November 2014) was 1.03°F (0.57°C) above average, the warmest such period on record. The anomaly is even more pronounced in the Norther Hemisphere, as illustrated by the image below.


Ocean temperatures can show much higher anomalies locally, as illustrated by the image below. The high sea surface temperatures near Svalbard give an indication of how warm the ocean current is below the surface.

2014 SST anomaly near Svalbard (green circle) Aug 26: 7.3°C, Sep 26: 6.7°C, Oct 26: 5.9°C, Nov 26: 4.2°C, Dec 26: 3.7°C
The danger is that ocean temperatures will continue to rise, especially in the North Atlantic, and that the Gulf Stream will keep carrying ever warmer water from the North Atlantic into the Arctic Ocean, where it will destabilize methane hydrates contained in sediments under the seafloor.

Methane

Methane levels are already exceptionally high over the Arctic, as illustrated by the recent NOAA image below. Since end October 2014, huge quantities of methane have erupted from the seafloor of the Arctic Ocean. As said, the primary driver of methane release from the Arctic Ocean seafloor is ocean heat. Water temperatures off the coast of North America get very high in July and it takes a few months for ocean currents to carry this heat to the Arctic Ocean. Further reasons why methane levels over the Arctic suddenly get very high from the end of October are discussed in this post.

The Gulf Stream will keep carrying water into the Arctic Ocean that is warmer than the water already there. These methane eruptions will therefore continue into the new year, threatening to further accelerate warming in the Arctic and cause even more extreme weather events, wildfires and further emissions in the year 2015, in a spiral of runaway warming. 


The combination image below shows the strength at which methane is erupting from the Arctic Ocean seafloor. On December 25, 2014, methane lights up the northern sky like a Christmas tree. The image shows levels at 6 km (19,820 ft) altitude, as recorded by, from top to bottom, MetOp-1 am (up to 2277 ppb), MetOp-1 pm (up to 2295 ppb) and MetOp-2 am (up to 2336 ppb).


MetOp-2 records for December 25, 2014, pm, are incorporated in the animation below, showing methane concentrations reaching levels of up to 2284 ppb at an altitude of 6 km (19,820 ft) and reaching even higher levels of up to 2329 ppb at an altitude of 9.3 km (30,570 ft).


The troposphere is deepest at tropical latitudes, where it reaches altitudes of up to 20 km (12 mi), and rather shallow at the polar regions, where it only reaches altitudes of some 7 km (4.3 mi) in winter. For high concentrations of methane to show up over the Arctic Ocean at such a high altitude is a further indication of the strength of these methane eruptions.

Furthermore, the methane that shows up in the atmosphere is only a fraction of the methane that is erupting from the seafloor, as part of the methane will be broken down by microbes as it rises up through the water and gets stuck under the sea ice.

Arctic Sea Ice 


Sea ice only 1m thin at North Pole.
Click on image to enlarge.
The above Naval Research Laboratory animation shows that, while sea ice is now covering the entire Arctic ocean, it is in many places only about one meter thin or less. The December 20, 2014, image on the right shows 1m thin sea ice at the North Pole.

Meanwhile, huge chuncks of thick sea ice are moving along the edges of Greenland and Ellesmere Island into the Atlantic ocean.

An exponential trendline based on sea ice volume observations shows that sea ice looks set to disappear in 2019, while disappearance in 2015 is within the margins of a 5% confidence interval, reflecting natural variability.

In other words, extreme weather events could cause Arctic sea ice to collapse as early as 2015, with the resulting albedo changes further contributing to the acceleration of warming in the Arctic and causing further methane eruptions from the seafloor of the Arctic Ocean.

Demise of the sea ice and snow cover in the Arctic results in further acceleration of warming, not only due to less sunlight getting reflected back into space, but also due to loss of the buffer that currently absorbs huge amounts of heat as it melts in summer. With the demise of this latent heat buffer, more sunlight will instead go into heating up the water of the Arctic Ocean. For more on the latter, see the page on latent heat

Feedbacks


Above image illustrates some of the self-reinforcing feedback loops that have been highlighted in this post. Further feedbacks are pictured in the image below.

from the Feedbacks page


Situation Calls For Comprehensive And Effective Action

The situation is dire and calls for comprehensive and effective action, as discussed at the Climate Plan blog.